A highlight of tips, tricks, and inspiration for Tableau and data visualization. A highlight of tips, tricks, and inspiration for Tableau and data visualization.Alle Storys
![]()
Why the Unveiling of Google Cloud Dataflow is Great News for Tableau Users
 26 Juni, 2014

5 Reasons to Attend TC On Tour in London
 19 Juni, 2014
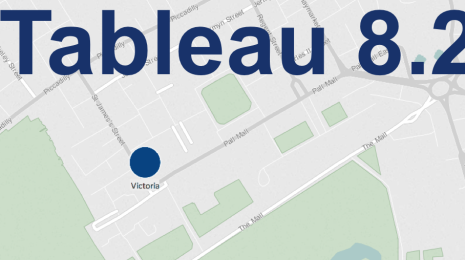
Mac Lovers and Data Storytellers Take Note! Tableau 8.2 Available Now
 19 Juni, 2014
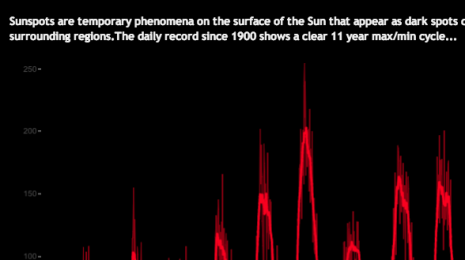
What is the Value of Visualization?
13 Juni, 2014

Nominate a 2014 Tableau Zen Master
5 Juni, 2014

9 data-blending tips from #data14de
27 Mai, 2014
Build narratives in your dashboards with Story Points in Tableau 8.2
20 Mai, 2014

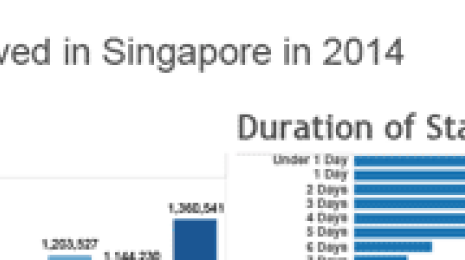
Where do YOU get inspiration for your dashboards?
20 Mai, 2014
5 reasons GlobalCollect deliver amazing analytics to over 500 customers
16 Mai, 2014

Best of the Tableau Web: Feb-April 2014
16 Mai, 2014
Best of the Tableau Web: May 2014
16 Mai, 2014
The Tableau Conference: What's in a Name?
15 Mai, 2014
Partners
The Google I/O announcement everyone is buzzing about is their new data pipeline service. Google Cloud Dataflow means ingesting, transforming, and analyzing big data in the cloud just got a lot easier. Even better, Tableau users already leveraging the power of Google BigQuery will be able to take full advantage of Dataflow to ease their heavy data lifting headaches.
Tableau Community
Sydney, The Hague, Munich are behind us. The final stop of Tableau Conference on Tour is ahead: are you coming to London on 7-9 July? We thought we’d look back at the first three On Tour events and share some of the key benefits of attending these conferences.
Product
It's official-- Tableau Desktop is on the Mac! Tableau Desktop for the Mac has the look and feel you expect from a native Mac application. It even has support for high-resolution displays like the Mac Retina display. It's part of Tableau 8.2, the newest release of Tableau, which also includes a new way to tell stories with data and a raft of other features.
Visualizations
V = T + I + E + C
Does the above equation contain all you need to know about measuring the success of your visualization? John Stasko thinks so, and he explained why in his keynote at EuroVis 2014, in Swansea, last week.
Tableau Community
Do you know a passionate Tableau evangelist? Are they constantly seeking to help others visualize their data? They are a potential Tableau Zen Master. Throughout June, we are seeking your nominations for the 2014 Zen Masters.
Data
Data blending is the ability to bring data from multiple data sources into one Tableau view, without the need for any special coding. Do you do data blending? Or wish you knew more about it? Here are 9 tips from one of our Tableau sessions delivered at the Tableau Conference in Munich this week.
Product
At Tableau we’re obsessed with data. Connecting to data, analyzing data, and communicating with data. Tableau 8.2 breaks new ground in communicating with data with the introduction of Story Points.
Visualizations
Designing effective dashboards is a challenge of design, usability, and efficient insight. There are many sources of inspiration. At our Conference on Tour in The Hague, Steffen Mueller (@iluvanalytics) from HERE built a NASDAQ-inspired dashboard of net promoter scores.
Enterprise
You may not have heard of GlobalCollect but you probably have used their services. They control web-based payments for many major services across the world. If you’ve ever bought something online it’s likely you’ve used GlobalCollect.
Best of Tableau Web
Best of Tableau Web
Tableau Community
Recently, one of our longtime friends, Andy Kriebel asked why we've dropped "customer" from our conference name. The answer? We welcome everyone to come and talk about data. The outcome of that is to further inspire our customers.