Track profit, loss with an intuitive CFO dashboard
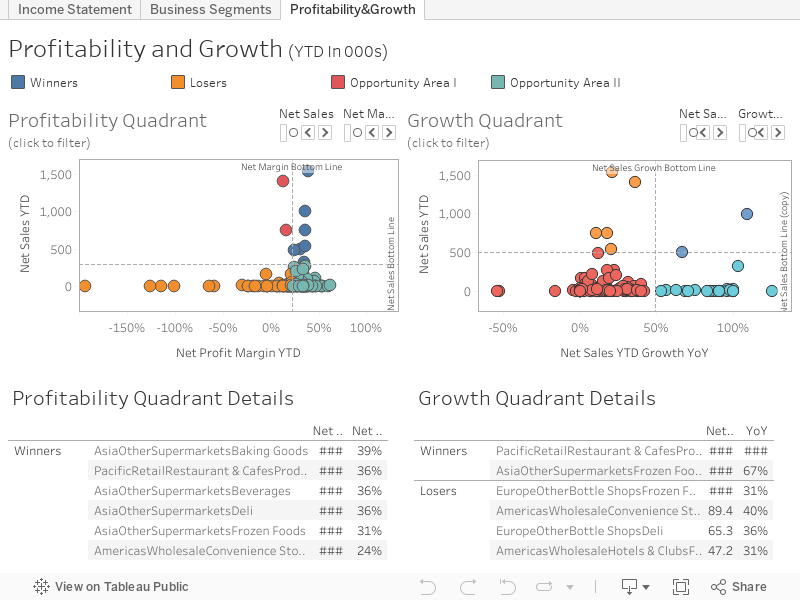
Analyzing profitability and growth is crucial to strategic planning and decision-making. We use a quadrant method in this example. By placing all product segments in dynamic quadrants, we can define winners, losers, and areas of opportunity. For the profitability quadrant, we put YTD net sales on the y-axis and YTD net profit margin on the x-axis. You can define the boundaries of each quadrant by inputting your own bottom lines for net sales and net profit margin.