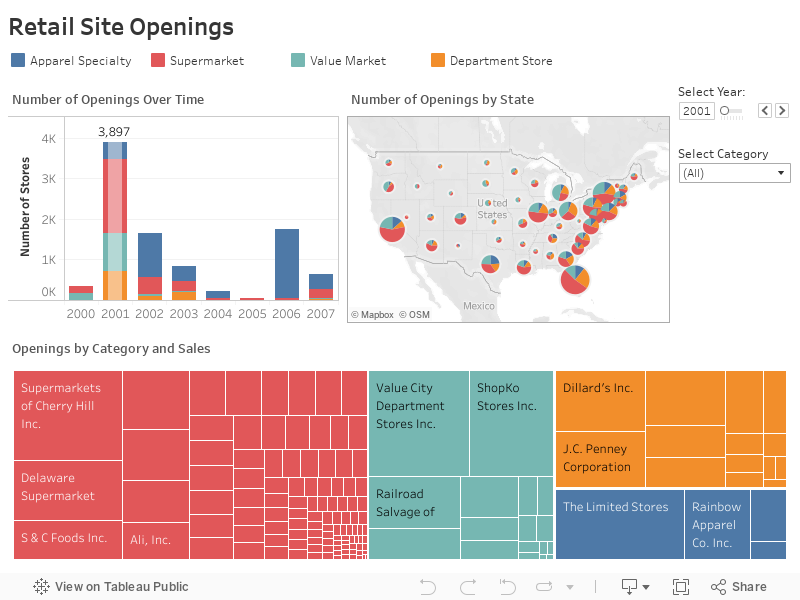
Visualize every retail-site opening in the US over several years
Think your retail organization has a lot of stores? This workbook captures every new retail store opening in the US from 2000 to 2007. Drag the slider on the year filter to highlight by year on the top left chart. The lower chart shows what types of stores were opened in a given period. If Tableau can bring that kind of clarity to years of data, what could it do for your retail business?