
University of Notre Dame: 10x faster analysis with Tableau + Snowflake
The University of Notre Dame provides a unique academic environment for more than 10,000 undergraduate, professional, and graduate students.
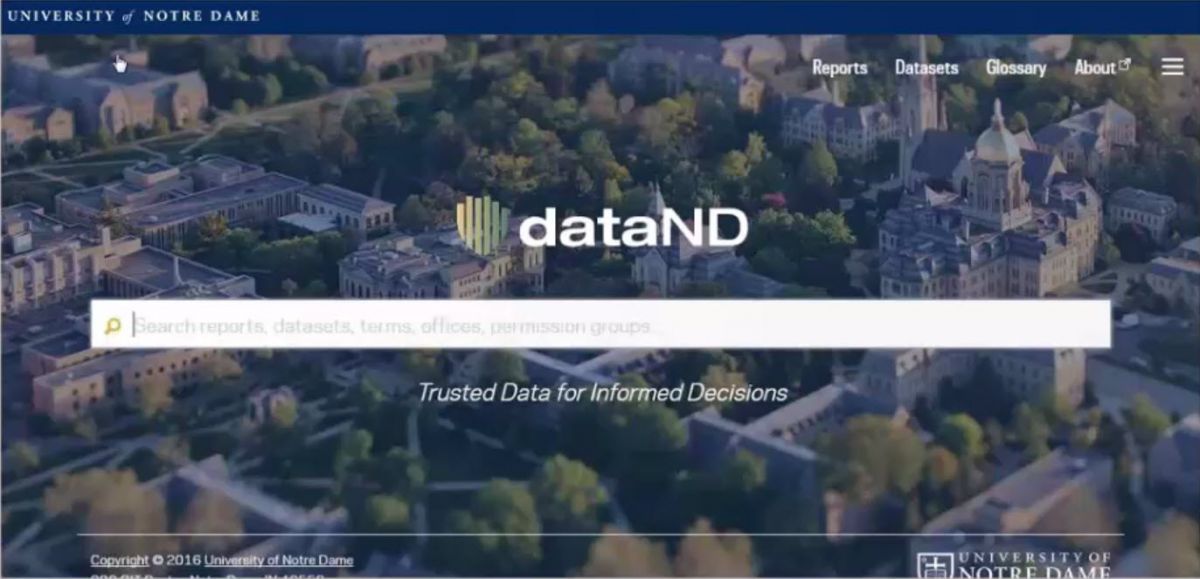
Today, the university accesses data through DataND—a campus-wide portal. With DataND, built on Tableau Server, employees access governed data and standardized definitions—securing one source of truth across the university. Offices also have the option to download workbooks. With Tableau Desktop, they can bring in relevant data sources to expand their analysis and answer ad-hoc questions. Reporting that used to take two months now only takes a couple of days.
Due to growing data, Notre Dame’s fundraising office adopted Snowflake Elastic Data Warehouse, built for the cloud. With Snowflake’s virtual data warehouses, they instantly match capacity with need—and in many cases, their analysis is 10x faster. Tableau users can take advantage of that speed with direct connectivity for both dashboard creation and viewing. With Tableau and Snowflake, Notre Dame has a platform that is scalable, fast, and accessible.
Previously, it took us about two months to build a report. Now, with Tableau, we can put a report on DataND in just a couple of days. And so that difference in time is dramatic.
Growing data, slowed decision making
Previously, Notre Dame struggled with disparate data, spread across the university. Departments had a difficult time getting data out of the enterprise data warehouse. Even when they succeeded in accessing the data, they struggled to interpret it. Standard reports took about two months to create.
“We knew the data existed, but we were struggling to get to it,” said Chris Frederick, Business Intelligence Manager, Notre Dame.
Each department worked in silos with their own data definitions, leading to inconsistent reporting across campus. If a decision maker had a question like, “How many students do we have?” each department had a different answer based on a small subset of data.
Understanding alumni interaction trends and finding new ways to keep alumni connected are crucial to Notre Dame. The university built its first data warehouse with a legacy warehouse vendor eight years ago. But the system couldn’t scale to Notre Dame’s thriving volume and velocity of data—a result of new, faster fundraising efforts. Queries could often take 30-90 minutes to complete.
“We decided to look into new solutions that could help improve overall performance,” said Frederick.
To keep pace with growing business demands, Notre Dame needed a flexible, scalable, and user-friendly data warehouse and a business intelligence (BI) platform that could keep pace with big data. Faster query performance and support for both concurrency and scalability were top priorities, along with reduced maintenance and overhead.
Learn more about the analytics portal powering the University of Notre Dame in this webinar.
Creating DataND—a new portal solution
Notre Dame first introduced Tableau within the Office of Strategic Planning and Institutional Research, where staff immediately enjoyed the software’s interactivity. The BI department observed their success and evaluated Tableau as an option to replace their existing data portal.
To increase data access, the BI team created DataND—a governed, campus-wide data portal. The team embeds Tableau Server into the portal to offer an interactive, user-friendly data experience.
“The goal for DataND was to share information more broadly with campus and to make it as easily accessible as possible,” says Frederick.
DataND features approved dashboards that help answer common questions. Employees download workbooks to bring into Tableau Desktop, blending with their own data sources to customize their analysis. In addition to DataND, each office has its own Tableau Server site for employees to share adapted workbooks and collaborate.
In response to the fundraising office’s growing data needs, the department adopted Snowflake’s Elastic Data Warehouse, built for the cloud. The team connects directly to Snowflake with Tableau Desktop to understand trends and help the university better structure fundraising efforts. Shared dashboards and reports also leverage direct connectivity to Snowflake, allowing end users to benefit from performance gains as well.
DataND allows us to spend less time on finding and extracting data and more time on analyzing and understanding its implications.
Speeding analysis from months to days
With DataND built on Tableau Server, Notre Dame created a single source of truth for data access and definitions. Offices can find quick answers with pre-built dashboards or download workbooks to further explore the data.
With Tableau, the BI team reduced cost and increased efficiency, with deeper analysis and less development effort.
“DataND allows us to spend less time on finding and extracting data and more time on analyzing and understanding its implications,” says Evan Grantham-Brown, Business Intelligence Professional, Notre Dame.
DataND provides governed access to the enterprise data warehouse, leading to faster, more accurate reporting. Frederick commented, “Previously, it took us about two months to build a report. Now, with Tableau, we can put a report on DataND in just a couple of days. And so that difference in time is dramatic.”
Tableau is the friendliest way for our business to explore data. When you're lost in a sea of data, a visualization can act as a sort of information map. When combined with Snowflake's speed, we can now explore this information map at the speed of thought and move from data to information to a decision 10 times faster.
10x faster analysis with Tableau + Snowflake
While its old data warehouse and analytics lacked the ability to quickly process and analyze semi-structured data, such as social media activity, Snowflake can natively understand and optimize transform both structured and semi-structured data. Today, Notre Dame can load any data into Snowflake without a predefined schema, and query it using ANSI-standard SQL.
“Tableau is the friendliest way for our business to explore data. When you're lost in a sea of data, a visualization can act as a sort of information map,” Frederick said. "When combined with Snowflake's speed, we can now explore this information map at the speed of thought and move from data to information to a decision 10 times faster.”
With a click of a button, Notre Dame can now immediately scale up its warehouses and storage, or even create new warehouses, with no need for adding capacity and backup systems. And in Tableau, the team can connect to any Snowflake warehouse to prepare dashboards in minutes.
Now, with more rapid run times and visual analysis in Tableau, analysts and campus leaders make faster decisions. End users don’t have to devote nights and weekends to generating reports. Additionally, Notre Dame’s offices can ask additional questions to fully understand their data and make informed, data-driven decisions.
Read more about flexible analytics at scale with Tableau and Snowflake.