

State of Tennessee fulfills multi-year economic and community development plan with Tableau
Reduced time spent preparing monthly reports by 12 hours
Achieved county-by-county perspective across nine regional teams
Enhanced project transparency with local government and taxpayers
The State of Tennessee’s Department of Economic and Community Development (TNECD) has a mission to develop strategies that help make Tennessee the top location in the Southeast for high quality jobs. The department seeks to attract new corporate investment in Tennessee from U.S. and global companies and works with local companies to facilitate expansion and economic growth. The department also has a suite of programs which facilitate site development, downtown revitalization, broadband expansion, entrepreneurship, and a variety of other community and rural development initiatives.
In early 2015, the TNECD prepared a strategic plan, identifying six key focus areas with long-term objectives, including reducing the number of economically distressed counties in the state, contributing to reduced unemployment and rising incomes. The plan carries through the existing administration, but its objectives and impact will last into the future.
To measure progress, the department developed 40 key performance indicators (KPIs). In conjunction they used Tableau to develop a set of dashboards populated with data from their Microsoft CRM system to track the statewide business and community development activities—including new investments in community development and companies relocating to Tennessee’s metro and rural communities. With closer monitoring with Tableau, the department is successfully fulfilling its mission, building out CRM enterprise-wide and elevating transparency with audiences. And now, staff can see how their work directly impacts the state’s economic growth.
Tableau has definitely started conversations within our organization of ways we can work together, and success of the project has sprung up new partnerships within the central IT department to do other things.
TNECD migrates to Tableau for automated analysis of strategic plan performance
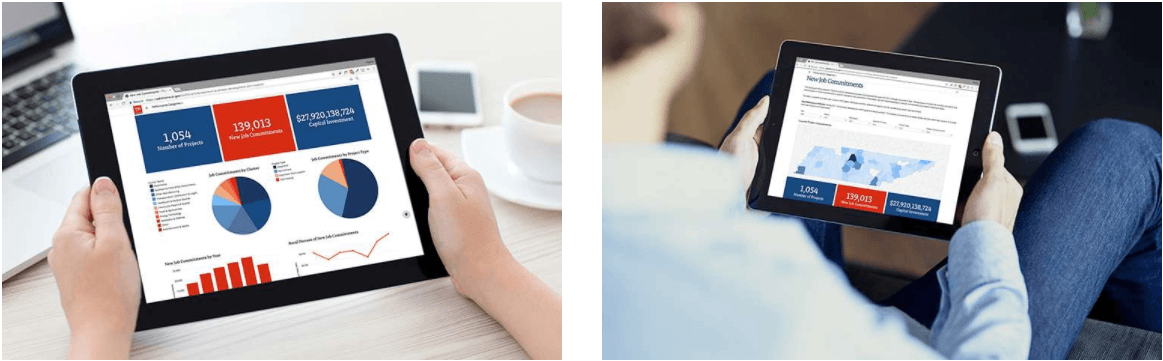
TNECD uses Tableau to share investment and programmatic information with a variety of audiences, including department executives, commissioners, partners in the General Assembly (who review and approve the Governor’s priorities and budget) and of course, taxpayers.
TNECD leadership reports on strategic plan progress on a quarterly basis. Previously, the department used Excel to track against KPIs but data extraction and analysis was inefficient, hindering transparency between the department and external stakeholders.
Sally Avery, Director of the Center for Economic Research in Tennessee (CERT), manages the department’s research initiatives and led the execution of the dashboard platform. The dashboards serve to bring the department’s strategic objectives to life in a visually appealing manner. “We wanted robust data on department activity and economic trends to be available to all stakeholders at any point in time,” explains Sally.
When the team migrated to the Tableau platform, they instituted strong data governance standards and expanded their centralized data repository, enabling them to share their progress against the strategic plan.
With Tableau, TNECD created customized dashboards for internal and external audiences that demonstrate who is investing in Tennessee and where jobs are being created. The dashboards encompass the entirety of the department’s work, with the option for citizens to drill into community-specific and programmatic details. These dashboards have caught the attention of audiences like county and state government officials and taxpayers, but also national media and government bodies. TNECD dashboards have been cited in the New York Times and The Center for Regional Economic Competitiveness (CREC) recognized TNECD’s efforts as showcasing best practices for other states.
“It’s not just about having a strategic plan that sits on a shelf somewhere,” notes Sally. “It really brings to life what we’ve set out to do and it’s visible. It helps us tell the Tennessee story of economic growth and community development.”
We can actually go look at that unemployment rate, see how many jobs we’re bringing in, and get excited about the potential for counties to move from a tier 3 to a tier 2 community.
State’s economic view strengthened with comprehensive data integration
An understanding of state unemployment rate and the impact of job creation coming from business done in Tennessee ranks high on the list of priorities for TNECD. The department analyzes a variety of economic indicators from the U.S. Bureau of Labor and Statistics, the U.S. Census Bureau, and other resources to capture information on employment, income levels, economic distress and other information.
Prior to this project, TNECD’s research center manually downloaded this data to create monthly and ad-hoc reports demonstrating changes in economic trends over time. Tableau has enabled CERT to easily share real-time data and trends occurring at a local level to Tennessee communities —a previously time-intensive task.
Statistical research specialists at TNECD like Katie Scott now have all that they need in just three clicks. “It saved me probably half a day of work every month. Before we were copying and pasting formulas a hundred, a thousand, or ten thousand times,” she shares. In the end, research staff spends more time finding insights and forecasting trends.
Miles Hutcherson, a Technical Project Manager with TNECD adds that federal data is so large, Tableau’s county-by-county analysis of unemployment is one of his favorites. Seeing the year-over-year change in Tableau and how it’s improved overall thanks to the business development efforts of TNECD is valuable. “We can actually go look at that unemployment rate, see how many jobs we’re bringing in, and get excited about the potential for counties to move from a tier 3 to a tier 2 community.”
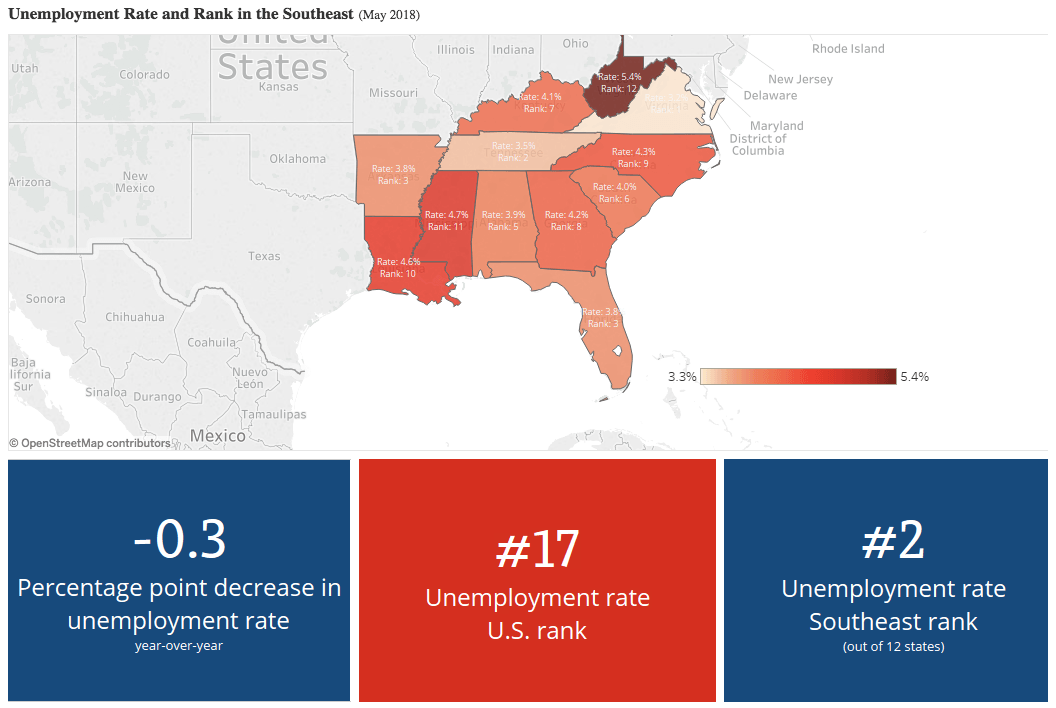
This dashboard demonstrates the unemployment rate for all 12 states of the Southeast and for all 95 counties of Tennessee. The long-term objective is for Tennessee to have the No. 1 lowest unemployment rate in the Southeast by 2025. View the full dashboard.
I’m able to do more analysis on the same data. A lot of the federal databases have such rich data, but with our dashboards, we can make information more accessible to community partners who only use the data once a year and don’t know how to retrieve it themselves.
Project funding demonstrates execution of rural and community development initiatives
In addition to economic statistics, the dashboards also reflect programmatic activity. TNECD activity reflected in the dashboards ranges across a variety of economic and community development programs—including, for example, a community’s participation in the National Main Street program or Tennessee’s ThreeStar program, preparation of a shovel-ready site, grant assistance for the expansion of broadband, and the recruitment of a foreign-owned company to a rural community.
“This combination of data is incredibly powerful,” says Sally. “It paints a connected picture between the work the department is doing and the outcomes we work to affect.”
As part of the dashboard platform project, the team expanded a Microsoft CRM system to consolidate the department’s programmatic data into one location. In addition to federal statistics, they access this departmental data through Tableau for analysis.
TNECD has built numerous visualizations that provide a snapshot of the assistance and project activity the department has engaged in—across multiple programs and communities, as well as over time. One such dashboard—titled the Community Investments Dashboard—gives perspective on TNECD’s community and rural development investments by region and program.
Another dashboard portrays the landscape of company expansion and relocation announcements across Tennessee’s counties and industries. Tecora Duckett, a Research Analyst with TNECD, reiterates: “It’s to let not only our agency know how we’re growing in different areas, and who’s investing in our state, but also allows the public to know who invests in our state and where we’re creating jobs for them.”
The department has made the dashboards available to the public. By enhancing transparency into program activities, the department can show responsible use of taxpayers’ funds, building greater confidence with the public and legislators. “It shows we’re co-investing in rural communities; making them stronger, more viable, and vibrant.” The outcome of such investment also becomes a reduction in the number of distressed counties, which the state of Tennessee is trying to achieve through its programs and initiatives.
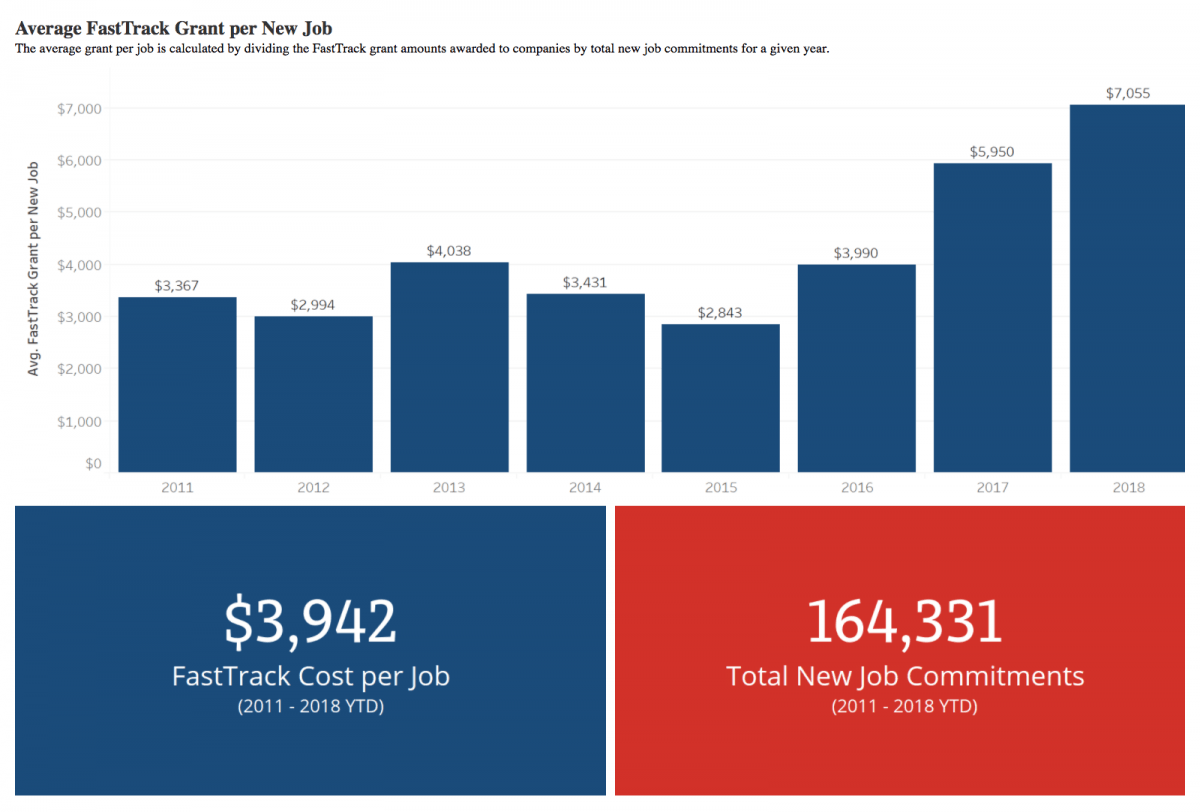
The Tennessee Department of Economic and Community Development (TNECD) aims to support net new job creation and capital investment through its FastTrack grant programs. This dashboard shows average grants per new job. View the full dashboard.
Now, the data from our Microsoft CRM Dynamic system is right there at the end of my fingertips in Tableau. We just write the code on the backend using SQL, and it does live extracts every day.
TNECD staff performance elevated with clearer view of deliverables
Every division within TNECD has a separate module in Tableau that is customized to their business and reflects their deliverables. There are status bars on the Tableau dashboards so any staff member, at any time, can click and see how they’re doing.
For example, the business development team handles engagement with local Tennessee businesses to identify project opportunities for job creation and capital investment from the private sector. Within that group are nine regional teams that work across the state to capture and analyze data from project activities on a daily basis. In Tableau, ECD management and taxpayers in general can look at average grant levels, economic impact and return on investment metrics to gauge the success of their performance and fiscal responsibility.
Ensuring there is real-time visibility into business visits and other metrics also provides more project management agility. The availability of real-time performance metrics enables management to identify inefficiencies and discrepancies and celebrate achievements. Tecora Duckett shared how going from periodic to constantly refreshed reporting has been instrumental. “Now, we actually have time to pull up the data, we can add to it, and help other divisions put whatever they want into our database.”
CERT and ECD built dashboards with support from Tennessee department, Strategic Technology Solutions (STS).