
An engaging and effective framework for teaching data skills in K-12
Around 400 year seven students every year equipped to explore and understand data to augment learning and research
Founded in 1917, Nanyang Girls’ High School (NYGH) is one of Singapore’s oldest and most respected schools. NYGH prides itself in providing a holistic education that empowers students to thrive in the globalised world of the 21st century. Data literacy is now an essential part of that education and is being taught to students in year seven (Secondary One) with the help of Tableau.
“We’re living in an age where data literacy is essential in our daily lives, in the way we think and in the way we consume information,” said Mr. Han Pin Goh, Head, Infocomm & Educational Technology at NYGH. "Teaching data literacy is therefore a gift all schools can provide students so they can become discerning consumers and creators of knowledge."
As NYGH’s students start to experience the benefits of data literacy, the school shares insights into its program and advice on how other institutions can prepare their students for a data-driven future.
I enjoyed being left to manage independently, while also being provided help if needed. It grants me the freedom to create what I like and experiment, but if I need help I can just ask, which is really convenient.
It’s never too early to start building data skills
Many higher education institutions have realized the importance of equipping future graduates with data skills. What NYGH has demonstrated is that students are capable of learning and applying these skills much earlier.
Discussing the school’s decision to make data viz a part of the year seven curriculum, Mr. Goh said it would be a waste for students to not make use of the data available to them today.
“If they don’t learn now, when? We believe it’s never too early to see, think, and interact with data,” said Mr. Goh. “Children are already accustomed to seeing data each day, from their YouTube viewer stats to their Spotify stream numbers.”
Visual analytics simplify learning and exploration
In the past, NYGH students learned about data through more traditional statistics lessons. They analyzed smaller datasets with the help of a calculator and plotted graphs with pen-and-paper. These classical skill sets are inadequate for the 21st century, leading the school to develop its own Data Viz curriculum leveraging Tableau.
“Students seldom have the opportunity to search for their own data, interact with that data, and derive their own conclusions and meaning,” said Mr. Goh. “Tableau’s interactivity and ease of use is a game changer and empowers students to be their own knowledge builders.”
With Tableau, students do not have to be experts in working with spreadsheets or write their own code to analyze or visualize their own data. Instead, they can create interactive dashboards using intuitive features like drag-and-drop and in just a few mouse clicks.
I enjoyed making the map because I liked seeing the gradient that showed the different prices. I could better visualise the different prices of housing in Singapore and I could see where the concentration of more expensive houses were which was really interesting to me.
Practical application makes learning engaging and effective
As part of NYGH’s Data Viz curriculum, year seven students spend an hour each week over three-months learning how to create and tell stories with dashboards. First, students are taught basic design principles so that they can visualize patterns and trends in an engaging way. Then, they are taught how to apply these principles in Tableau. Finally, the students are given time and space to build dashboards on their own.
One thing that’s made NYGH’s curriculum so effective is that students are encouraged to work with real datasets that relate to issues they’re passionate about.
In one example, students used Tableau to explore a public dataset on public housing resale prices in Singapore. They were able to uncover time-series trends and geographical disparities, helping them to have more informed discussions about housing and social issues.
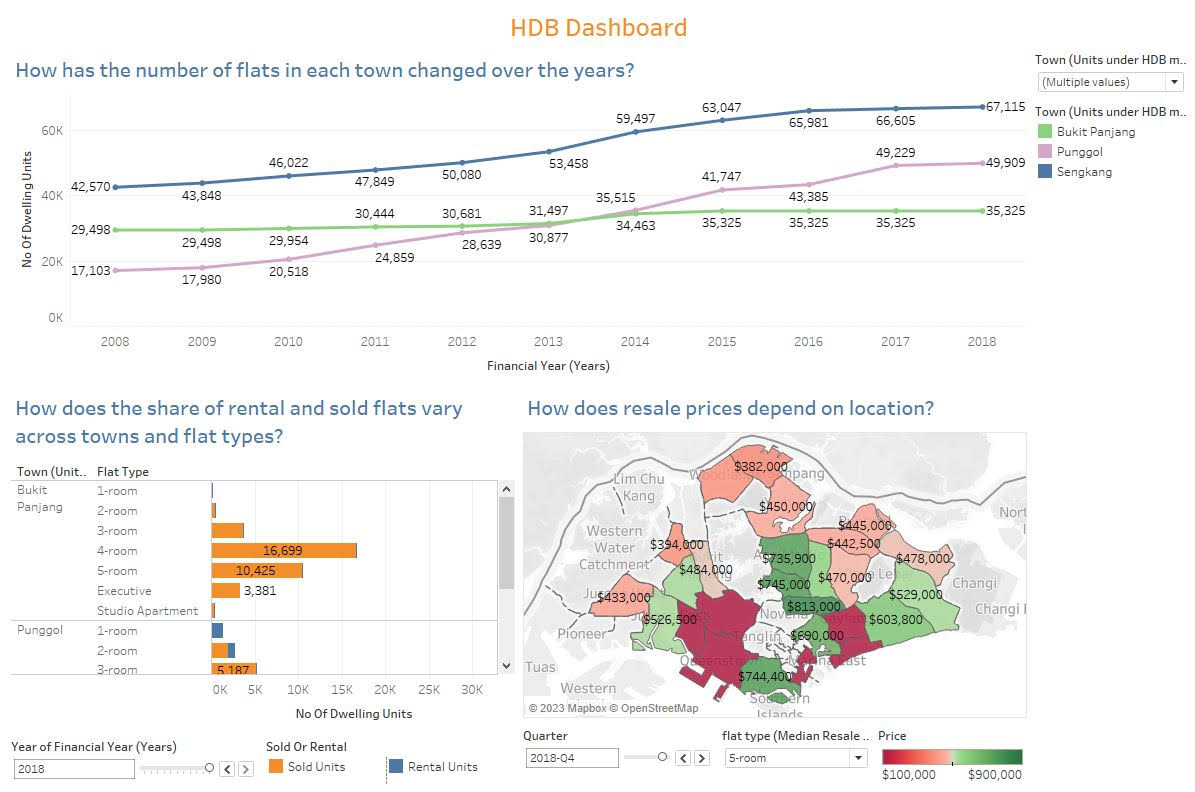
Housing trends dashboard created by students using publicly available data at Data.gov.sg
Other topics explored by students include social and global issues such as gender disparities in higher education courses and international trends in global warming.
“By empowering students with an easy to use tool like Tableau, they can explore data at their own pace and uncover insights by themselves. They can also dig into the patterns and root causes of social issues, and not just rely on what they hear or read elsewhere,” said Mr. Goh.
Data skills are key to empowering next generation of changemakers
NYGH’s Data Viz curriculum supports its pioneering efforts to develop a generation of changemakers empowered by data. It equips students to gain deeper insights into topics of interest using data available on the internet or data they collect themselves. It also allows them to gain a more nuanced and authentic understanding about textbook claims or current affairs.
In future years, students may choose to take up more advanced elective modules on Data Viz and apply them onto their research projects. They may also initiate service-learning projects where they apply their data skills to teach or serve others in the community.
Asked what advice he had for other K-12 teachers and administrators, Mr. Goh stressed the urgency and simplicity of teaching data skills.
“Start today by collaborating with a group of passionate teachers and be curious. Find datasets you are interested in and start exploring them in Tableau. Finally, allow students to surprise you with the amazing data stories they can narrate themselves,” said Mr. Goh.
I really enjoyed the process of playing around with Tableau, as I think it’s a really interesting way of presenting data. I also enjoyed the time interacting with my friends, as we learnt about this software together. It was really enjoyable.