How to Steal from the Best


Most people's New Year resolutions are to work out more, eat less, learn Python. My new year resolution is to steal and cheat more! I hope to tempt you over to the dark side of data-journalism and visualisation with my 10 easy steps of how to steal from the best.
You might want to listen to me because even though I've only used Tableau for under a year, I've already made one of the most viewed vizzes of 2014. According to Dash Davidson, at least. If you read Norwegian or know how to use Google translate, you could read the story that accompanied it at ABC Nyheter, as well. I also used Tableau for our big summer project about the last summer Oslo was occupied by Germany.
The reason why my visualisations have worked quite well is mostly because I steal like a raven! I scour the lands of Internet for the coolest, most insightful visualisations and graphic illustrations and cool datasets. From these I will learn how to do the one technique that makes them stand out: a calculation, use of colour, the use of fonts or the idea itself.
Surprisingly, most of these visualisations are not done by Norwegians, in Norwegian or with data about Norway. I often end up with having to build my own datasets, because what I want, just does not exist.
I love the people who blog about how they make their visualisations and most important of all: I download. Which is the part I will tell you about now.
Have you ever noticed the little link at the bottom of all Tableau Public (and Datawrapper) vizualisations? Well, notice it now, because it is your friend. With it you can take a peak behind the scenes. You can see how that cool thing was done and do it yourself!
That magical button will make all your data dreams come true.
1. Know your data.
For this example project, it was easy. I built the database myself.
For my first visualisation, which turned out to be the baby names viz, I worked together with Statistics Norway to get the right data. And I based most of what I did in Tableau on Jewel Loree's very good blog post about American top names and her amazingly pedagogical tutorial. But her data was actually quite different from mine. I could replicate some of it. But I made quite a few mistakes before I understood that.
2. Get inspired.
Start with Data is Beautiful, your favourite data-guru, ninja, unicorn, wizard or hobbit. Or at least check out the daily pick from Tableau.
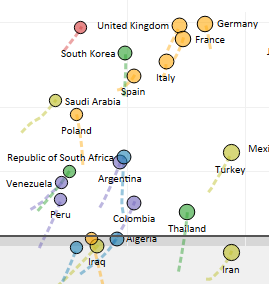
I am totally going to steal this little feature with the little dots representing the history, from John Schoen's Rise of the Global Middle Class.
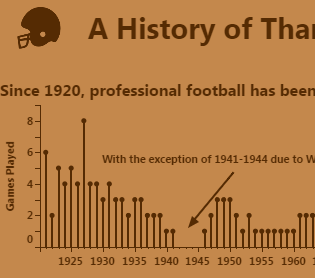
And I just love the colour scheme of Curtis Harris’ History of Thankgsgiving Football. And I've already figured out how to do the little dots on top of the graphs. That is such a cute little feature.
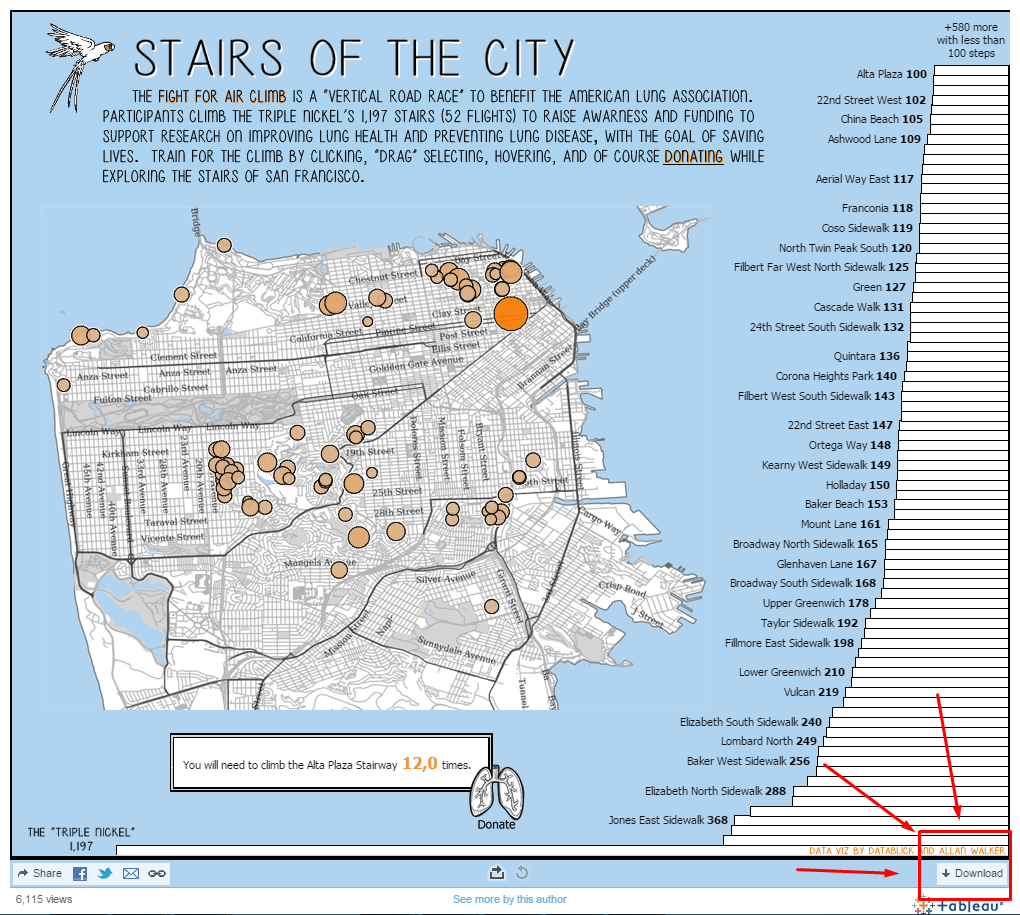
For my latest project, I have been trying to figure out how to show 30 objects at once. A horizontal menu would make the objects too small and a vertical is really not very practical…
But then I saw Steven Carter's amazing visualisation: The Adoption Gap. Lo and behold!
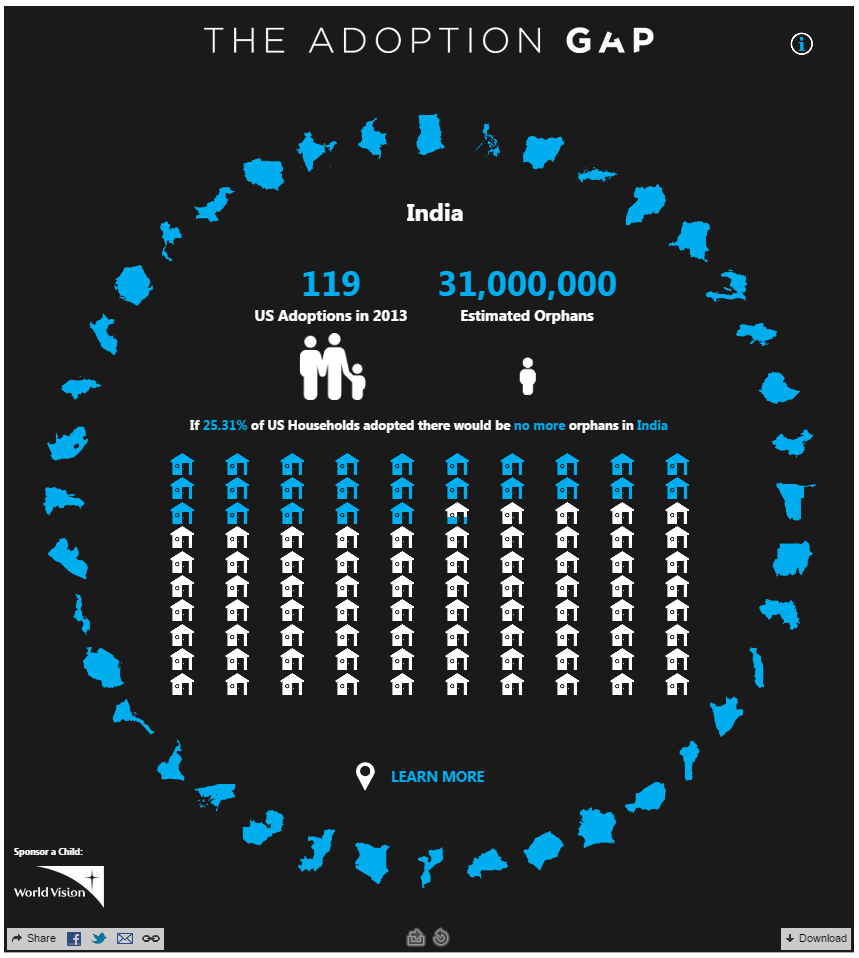
The circle! It's perfect!
3. Download it.
If you see something nice just do it: Download it. It does not take long, and even though you can’t use it for the project you’re working on now, just keep it and you can use it as a library for inspiration or how-to-manuals later. I have several workbooks that I just keep around just to look up how to do little things that I love. These tasks are easy to forget before you have done them several times.
4. Find the hidden sheets.
Except for the actions, most of the action in Tableau happens in the sheets. Most people choose to hide their sheets before saving the visualisations. From the dashboard you can easily go to the sheets or unhide them:
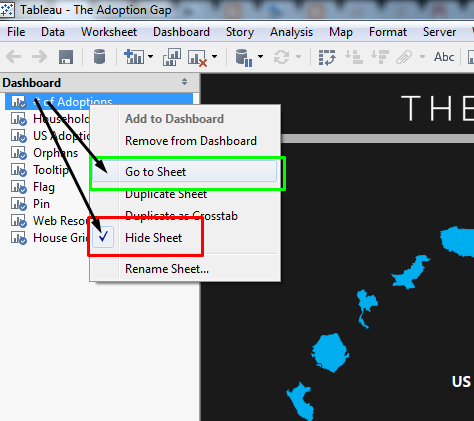
The hidden treasures...
5. Tsk, tsk, at the mess!
Most people don’t think about the fact that other people will snoop around in their sheets and data either. They give their sheets, parameters, dimensions, measures names that only their mother might understand. (The chosen example in this post is more the exception than the rule for this, so I can’t show you any good pictures of this. I would of course show you my chaos, but it’s always a mix of Norwegian an English, so let’s just leave it, ok?)
My point here is to tell you:
Show me the data!
In The Adoption Gap, Steven used the number of adoptions as an underlying variable to make his circle. As my data was different from his, I needed to understand his data as well as mine. A quick, sneak peak at his data tells me everything I need to know.
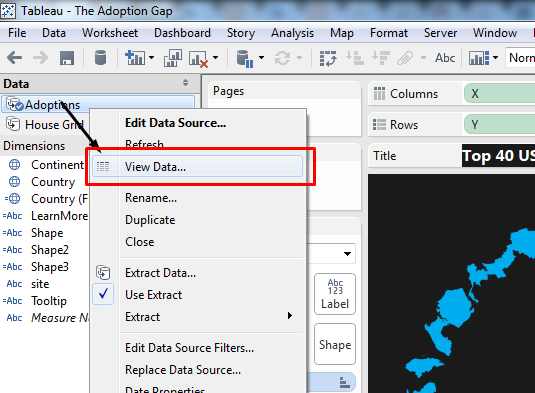
Show me the data!
6. Take it apart.
Duplicate the sheets and dismantle it! Thank the great Tableau-developer who insisted on infinite back-button. (Thank you! So MUCH!3)
You might have understood from the previous paragraph, it's not like most of us can just look at a sheet and see how something was done. You need to take stuff apart to see what each part does. My trick here is to duplicate the sheet, and then mess around with the copy.
My main objective at this point is to find out which dimensions, measures, sets, parameters, calculated fields etc that are necessary for the circle to work. It is also important to understand how each element connects to the others.
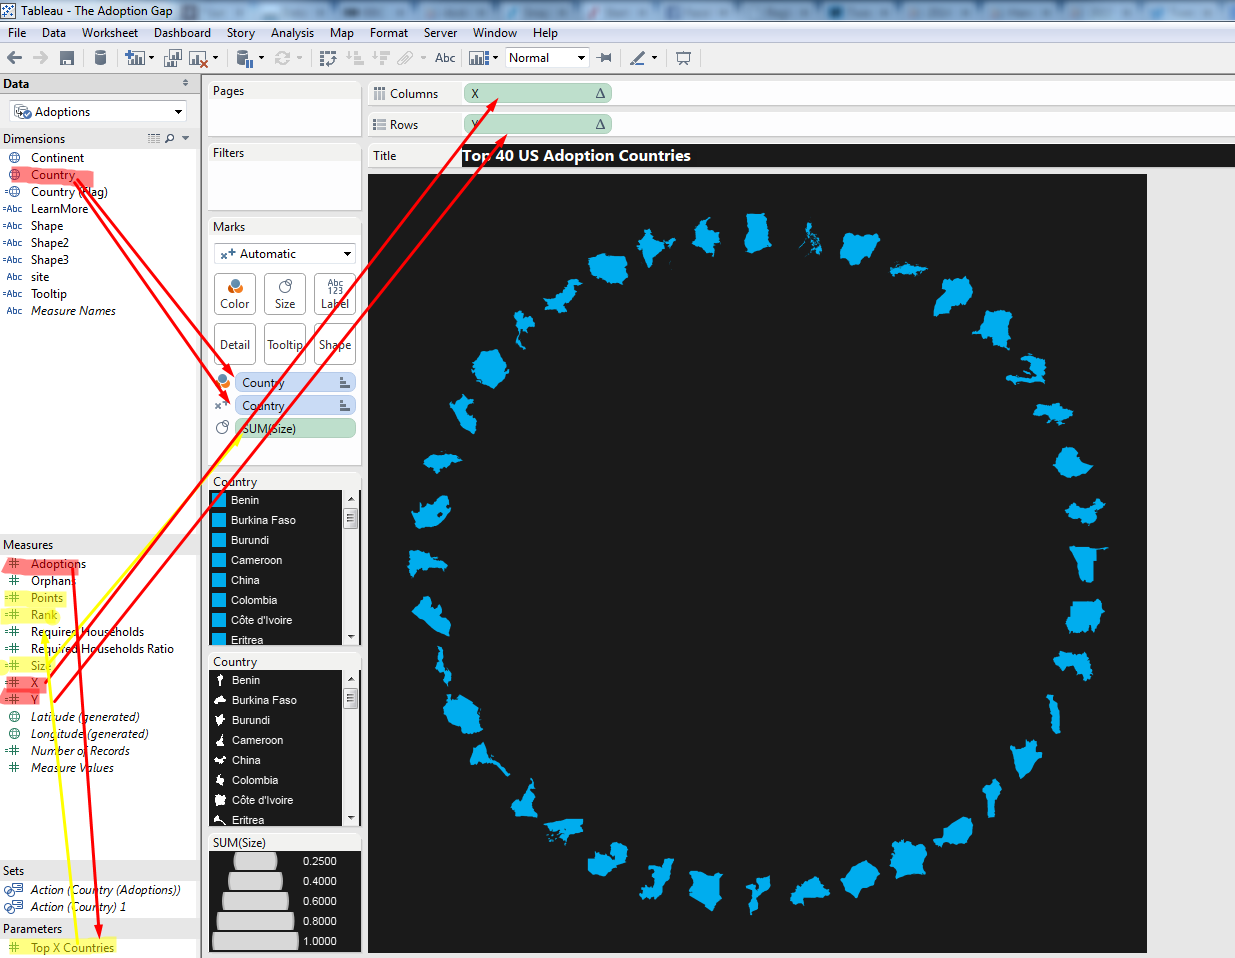
Which elements are necessary and which are not?
7. Get stuck and google the parts that you don’t get.
I hereby predict that you will get stuck. I will tell you how I got stuck with The Adoption Gap:
Steven has a parameter that’s not necessary that gives you the option of choosing how many elements you have in the circle: Top X Countries. This is cool, but I will not use it. For his quick filter to work with the placements in circle he also has a calculated field: Points, which I don’t need either. For my visualisation I have 30 elements and I have decided to use them all.
(This is what I think at this point, but I will rue my words!)
Then Steven has his Rank-calculation. This is based on his data: the number of adoptions for each country. This is where I got stuck. I could not figure out why Rank was necessary. My advice for anyone who gets to this point is to try to google the problem. There are so many amazingly skilful people out there who every day blog about Tableau that you usually find something that will help.
Not surprisingly, Steven has actually been blogging about this visualisation!
And BTW, he says:
"explore other layouts besides a grid and steal like an artist (the idea for the household grid came from Dan's "Show Me the Money" viz)"
See, it’s not just me! Steal like a raven!
Back to the point where we are stuck, and start reading about how he did it. So I start out with high hopes of making my perfect circle and get to this:
"A circle is composed of 360 degrees or 2π radians."
Yeah. Ok.
Which moves me on to next point.
8. Read and get even more stuck.
Let me start with this: Stevens blog post was really good. And now, that I have figured out how to do the circle, I totally get it. He actually describes it quite well. My point is that I'm a journalist. I'm sitting in an open landscape. My visualisation are always like a month past deadline. I have three stories waiting to get done. I'm not capable of accepting that a circle is 360 degrees or 2π radians.
What do you do then?
9. Just try it!
Seriously. Just do it. This is the most important thing I will say! (Except for know your data, don’t publish stuff you don’t understand and credit your sources and inspirations). At this point I'm just duplicating the necessary calculated fields, X and Y. I added my own ranking instead of Stevens Rank and Adoptions. And…
My result was very disappointing. First the icons just spread out, then it spread in a half-circle, but there was a lot of overlap. Then it was something like this:
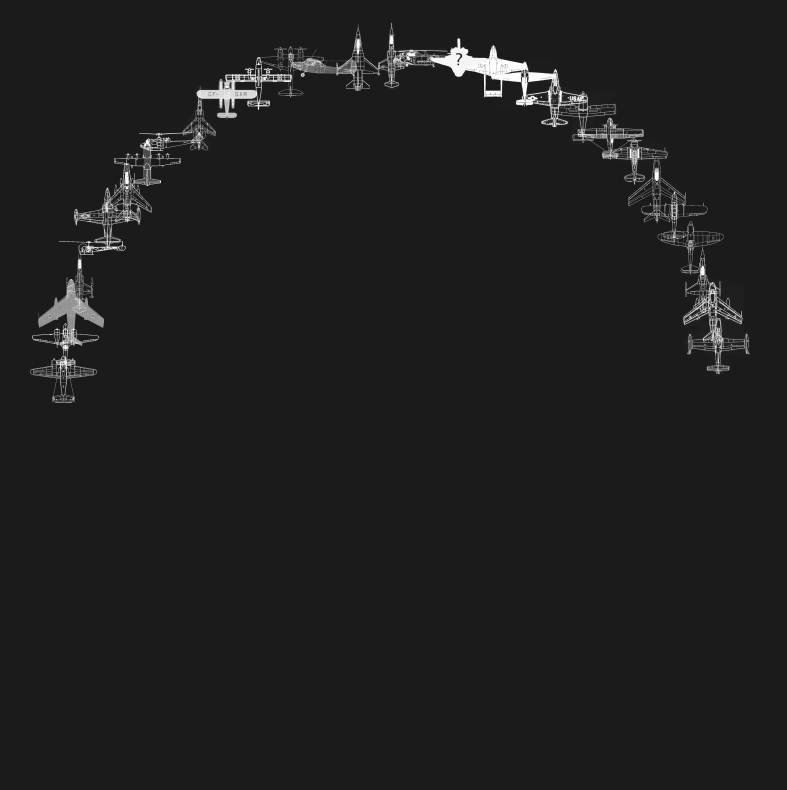
Nope.

Nope.
There are probably a lot of viz-wizzes out there laughing pretty hard now. If you understand Stevens sentence above, you will probably understand where I missed.
There are a lot of possible traps in doing stuff you don’t understand. For me, I use this as a way to figure out how it works. I would never publish something without really understanding it, because you could be wrong. That does not imply that you should not try in the first place, because if you don’t try to replicate you might not really get it at all.
10. Sleep on it. Talk through it.
I need to talk to think sometimes. I just bug the people around me into listing to my problems. (So sorry, and thank you, my dear colleagues!) For this project, I talked to our back end-wizard, Nico, who of course totally gets the point that a circle is composed of 360 degrees or 2π radians. When I explain to him how I tried to do it, I also understand what is missing.
Steven had added a small piece of the puzzle in one of the calculations I did not think that I needed. It was “/2”. So when I took that into consideration, I got the circle!

And look at that! It works!
How I did it:
- Calculated field: Rank
- Calculated field: X
COS([Rank]*PI()/[objects_you_want/2])
So for me its COS([Rank]*PI()/15), because I have 30 objects. - Calculated field: Y
- SIN([Rank]*PI()/[objects_you_want/2])
- Add your objects and define the shapes.
- Put X on Columns-shelf and Y on Rows-shelf.
- TADA!
RANK_UNIQUE(SUM([Your_meassure]))
If you want to know why that works, I can only recommend Steven's great blog about the technique.
(You will be able to see for yourself how I did it as soon as my visualisation is published. It’s not scheduled for publishing until later this spring, but I’ll be sure to add a comment with the link!)
And please: Credit where credit is due! We might be thieves, but let's be polite about it!
เรื่องราวที่เกี่ยวข้อง

Iron Viz 2026: Read Between the Data
 May 28, 2026

Tableau's Iron Viz Winners

Explore the 2026 Iron Viz Entries
 ธันวาคม 15, 2025