How governments are using Tableau to keep you up-to-date on the coronavirus


[Editors Note: Shortly after this blog post first published, New York State posted a set of dashboards that provide New York residents and the world with a daily look at the latest testing and confirmed case data at both a state and county-level. This data, also shared by Gov. Andrew Cuomo during his daily briefings, has become vital as the nation follows how New York is responding to the unfolding crisis. Click here to view the dashboards.]
There’s probably no time in recent memory when up-to-date, accurate data has been more important—or more in demand from the broader public. With the coronavirus continuing to spread through communities across the world, people are seeking information they can trust. And public officials are working as quickly as they can to make sure that people are able to access that information at the same time that they’re conducting their own internal data analysis to understand need and craft policies and strategies to respond to it.
Governments have a heightened responsibility now to serve as an authoritative source of truth for people, adds Steven Spano, Regional Vice President for Public Sector at Tableau. “The importance of truth is that it helps to calm fears, it helps achieve goals, it gets at information on best practices and the reality of the situation.” States, he adds, are using Tableau to analyze data and inform some of the most significant decisions they’ve had to make in decades. “It’s allowing better decisions to be made,” Spano says. “If you listen to Governor Cuomo’s daily briefings for New York State, you’ll hear him say that the data is showing that the mortality rate growth is slowing—that shows that what they’re doing is working, and gives them a chance to recalibrate strategy and constantly reassess. It’s all about: Do you have the right data? And then can you refresh it, analyze it, and then pivot if you see something that challenges your previous assumptions about what you were doing?”
At Tableau, our State and Local Government Analytics team is working with governments across the world on providing transparency and accurate data amid the COVID-19 outbreak. Governments are continually analyzing the data that they have on the coronavirus outbreak and its impacts to make decisions on policies and mitigation measures like business closures and stay-at-home orders. And they’re communicating important data out to the public so people are informed and able to understand what’s happening in their communities.
“This disaster is an ongoing disaster. And it has a trajectory to it. And that trajectory is different in every single community,” says Dr. Barry Chaiken, clinical lead at Tableau Healthcare. “So people who do not have an understanding of epidemiology and medical science have been at a loss to be able to understand what's happening: What does this mean to me? What's the meaning to my community, my family?” Clear public information is important, he adds, for answering these questions, and for making people feel less threatened and vulnerable in the face of this constantly evolving challenge.
Chaiken, who lives in Boston, said he witnessed the importance of accurate, public information in real time after reports emerged that over 100 COVID-19 cases could be traced back to a corporate offsite held recently in a Boston hotel conference room. “Frankly, we were all scared to death that it was just going to go like a wildfire through the Boston community,” he says. But Boston had, by that time, stood up public dashboards showing case data in the area, and people were able to see that the spike they feared was not actually materializing in the data.
By making their COVID-19 data dashboards accessible to the public, a number of governments across the U.S. are enabling people to understand the data for themselves, and to see firsthand how decision-making is influenced by what’s represented. Here are just a few examples of how governments are using Tableau to communicate essential information to their residents:
California Health and Human Services
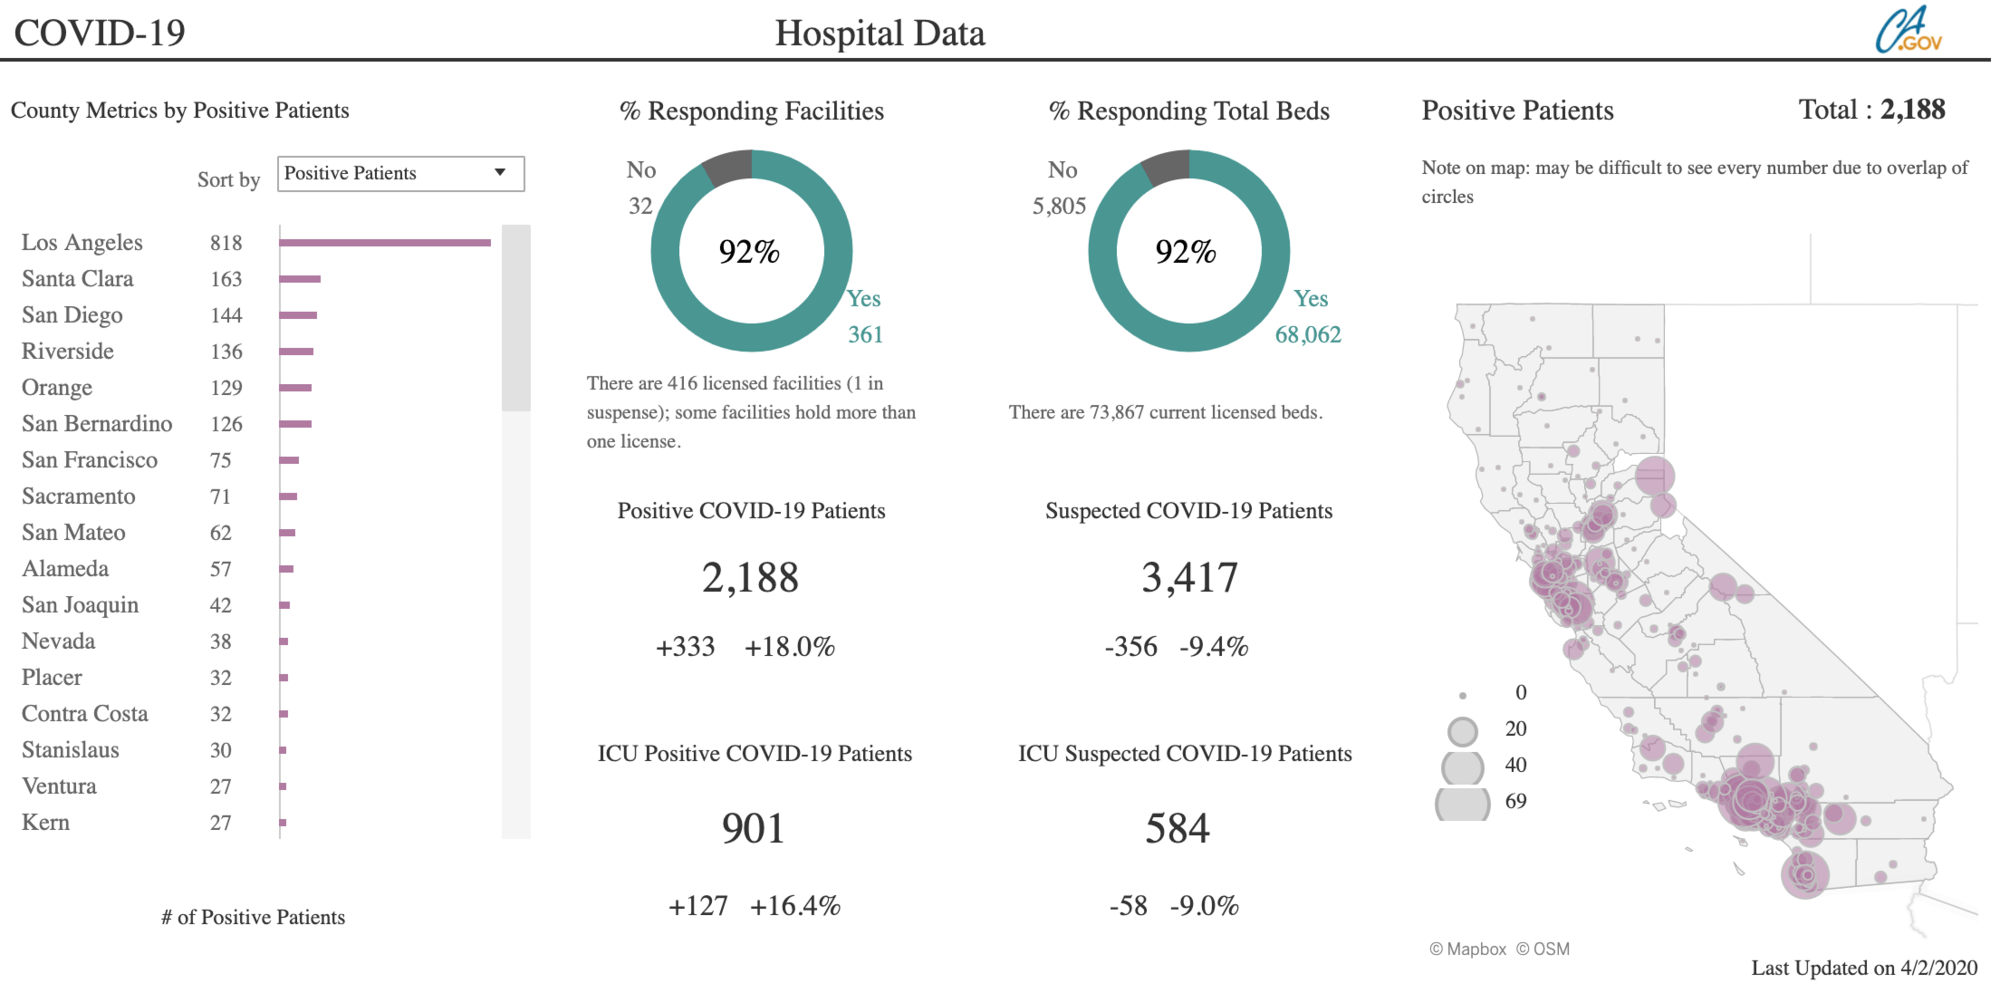
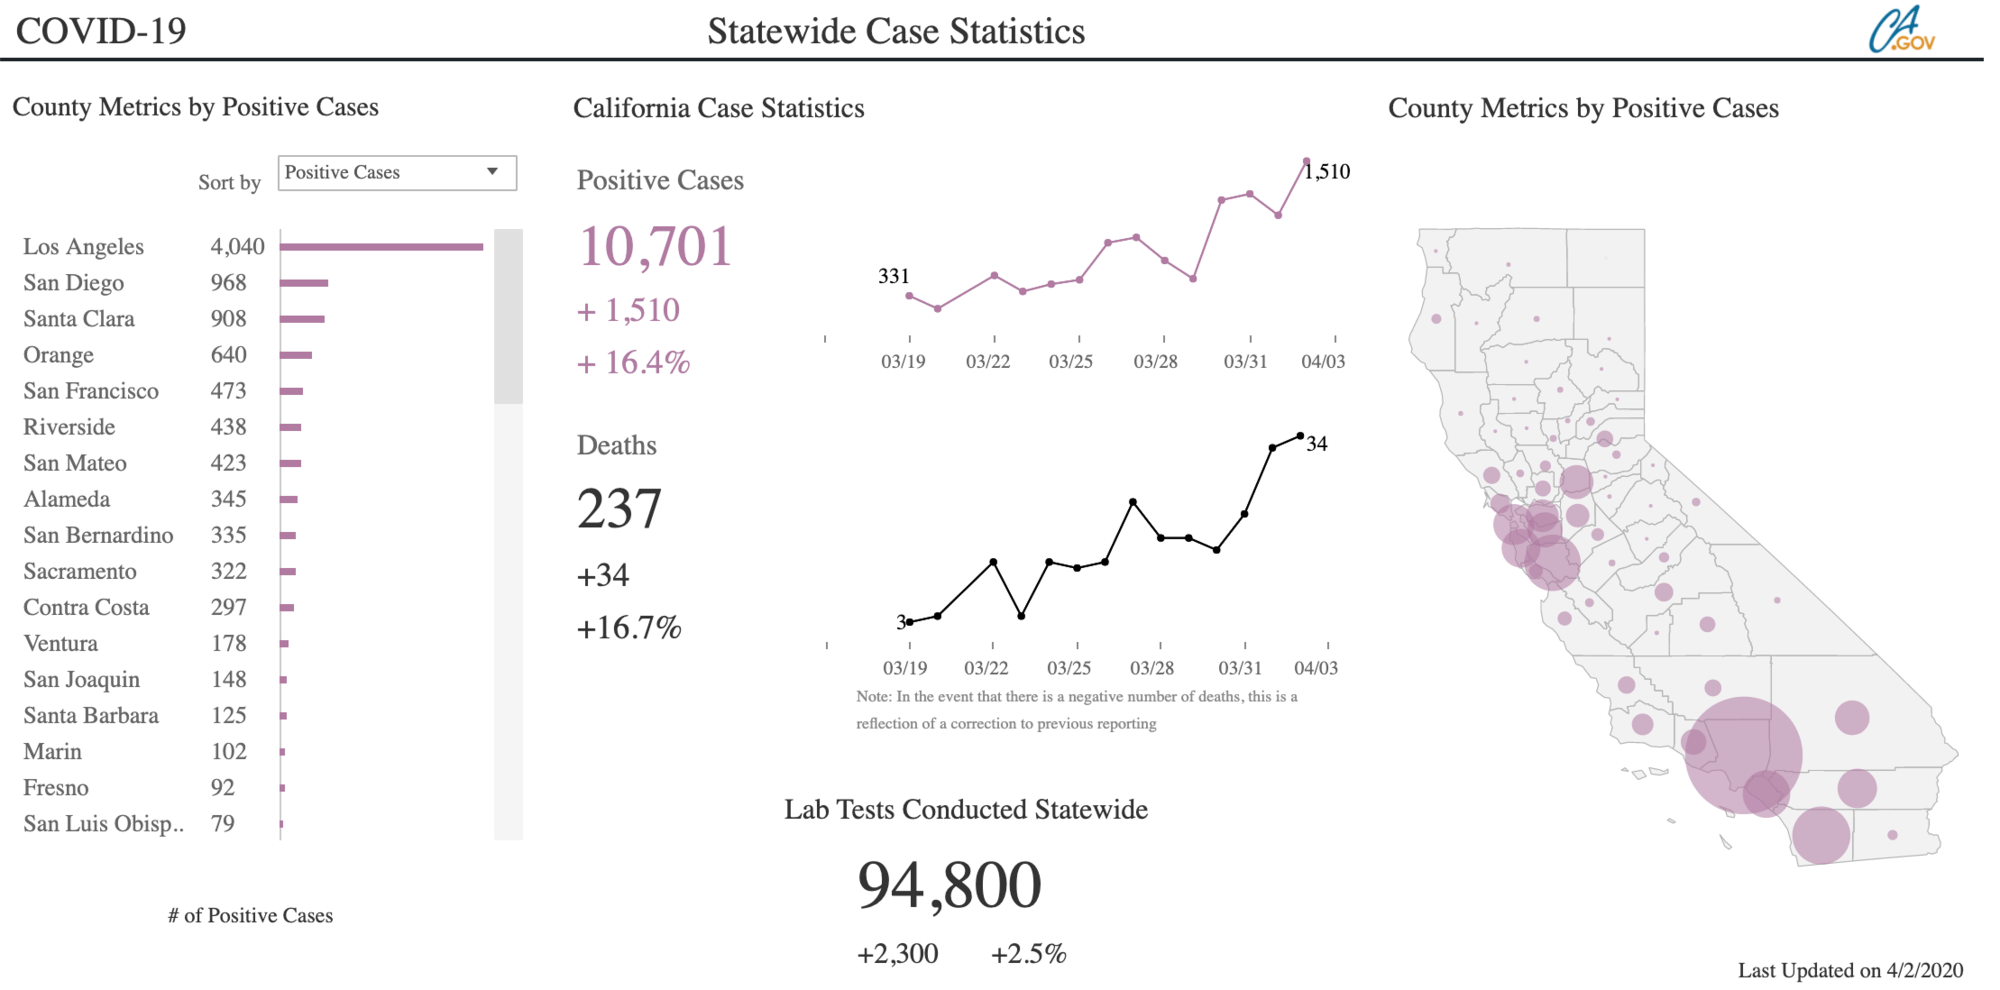
The state’s health agency has created two dashboards on Tableau Public: One shows COVID-19 case statistics at the state and county level, and the other shows data on the state’s hospital system. California has been very proactive in its response to the COVID-19 outbreak, and Governor Gavin Newsom was the first governor to issue a statewide shelter-in-place order. Early data is showing that this approach could be effective in flattening the curve, and as the situation evolves leaders in the state will be able to use this public data to advocate extending effective measures like social distancing.
Having this visibility into the data is especially important, Chaiken says, as measures like stay-at-home orders go on for weeks or months. “With the data, we can see that initiatives like what California is doing are making a difference,” he says. “People can see beyond the fact that they can’t go outside, or they feel like they’re sacrificing something, to seeing that they’re part of an effort that’s potentially saving people’s lives, or saving their own life. These dashboards are incredibly important because they keep people motivated to stay the course. Without this information, people can’t see the effect that they’re having or the good that they’re doing.”
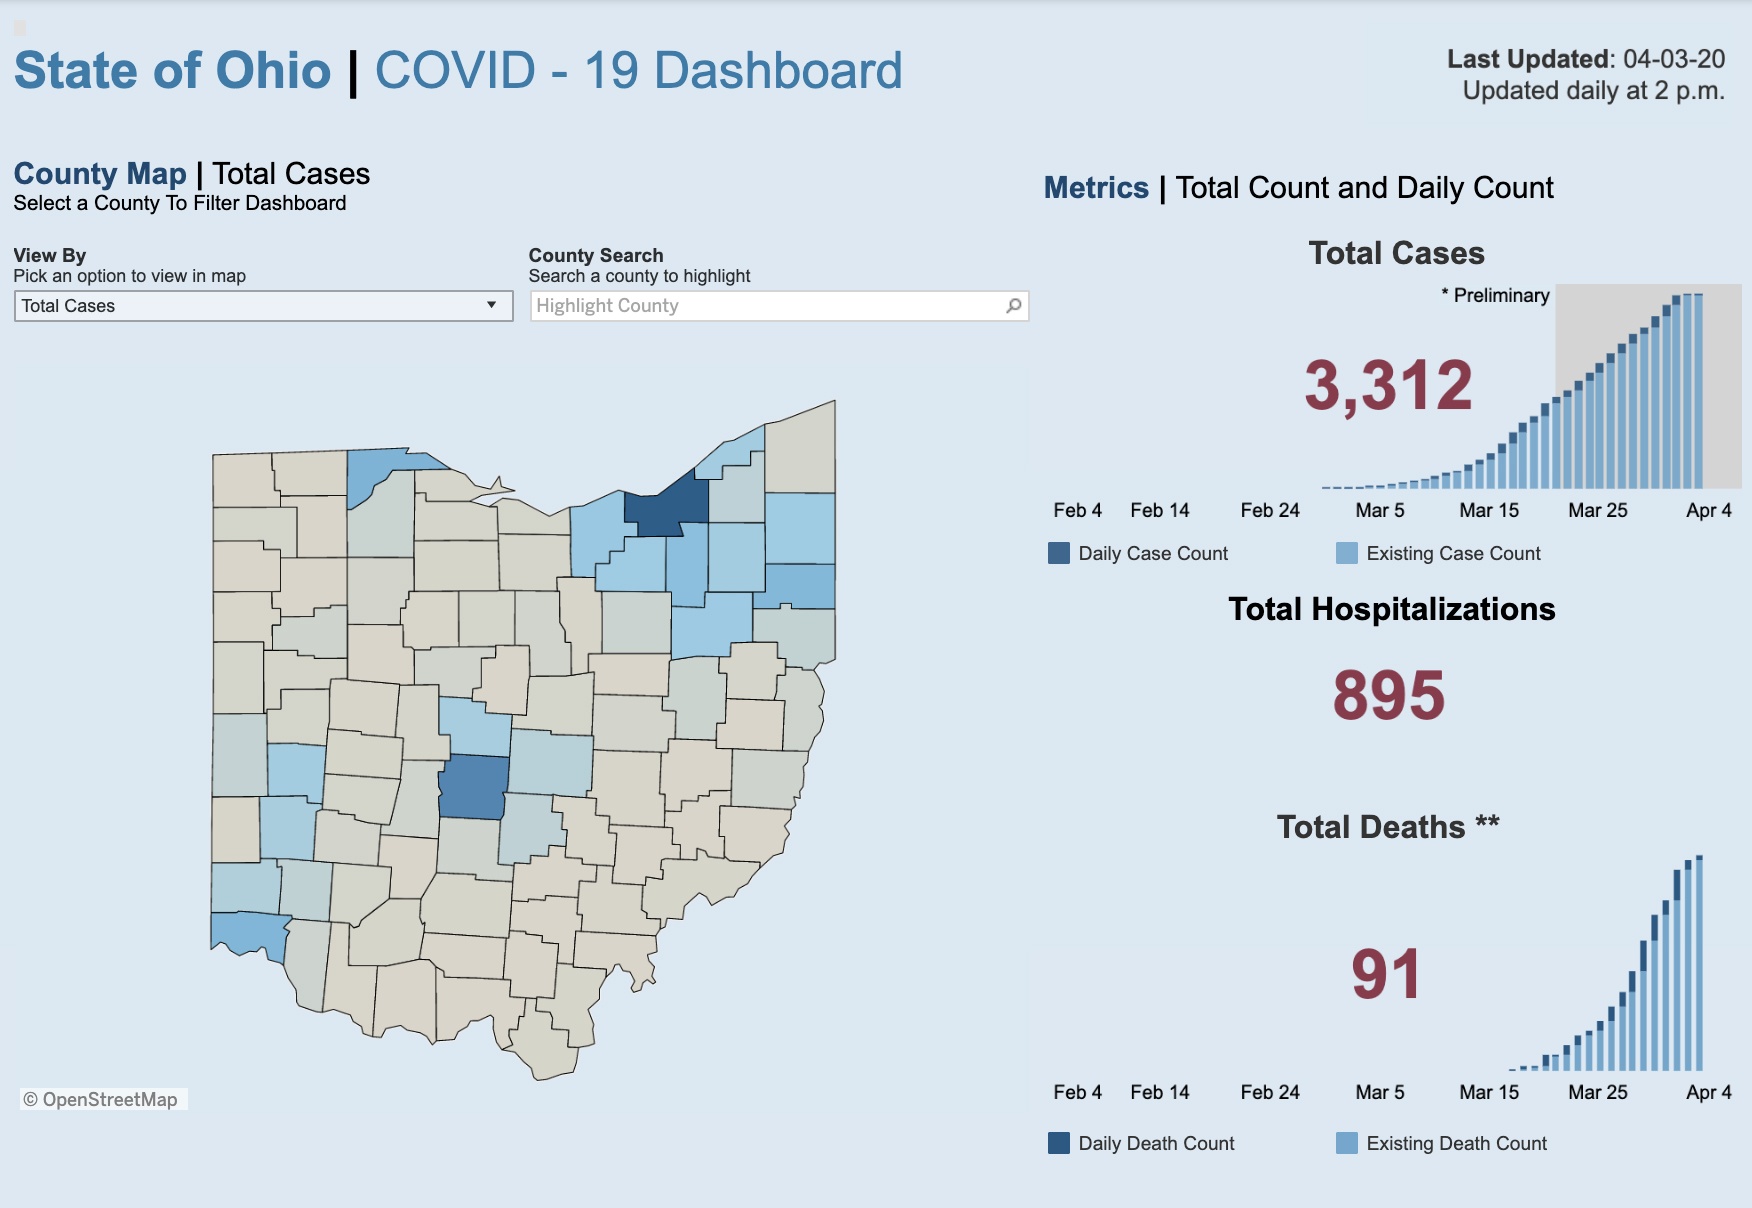
Ohio Department of Health
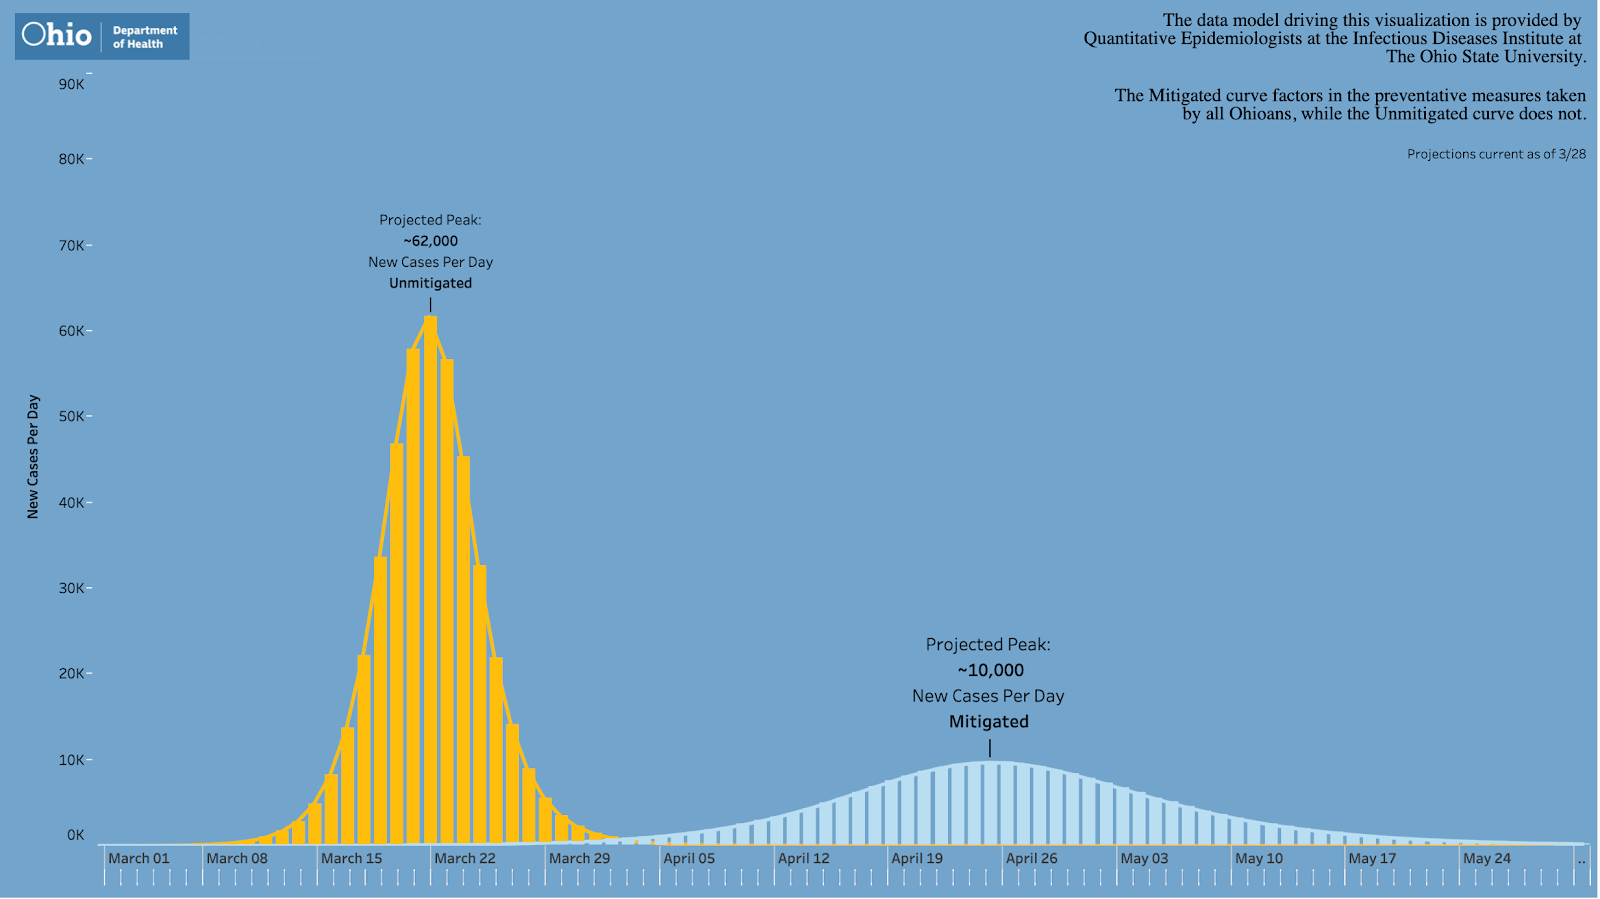
Governor Mike DeWine is using a regularly-updated dashboard in his daily COVI9-19 briefings to the state, where he shares the latest case numbers and advocates for important behavioral changes like social distancing. In the dashboard it built out, the Ohio Department of Health included a forecasting model built by Ohio State University that shows the projected trajectory of the virus in Ohio (based off of available data).

Dr. Amy Acton, Ohio Department of Health director, explaining the state’s dashboard during the Governor’s daily briefings (Photo credit: Governor Mike DeWine’s office).
The model clearly shows that without mitigation efforts that the state has implemented, like the Stay At Home Order, the peak of the virus would be much more severe. Communicating data to the public in this way is critical for creating shared understanding and buy-in for long-term mitigation efforts, and reminds everyone that they have a role to play.
View the dashboard.
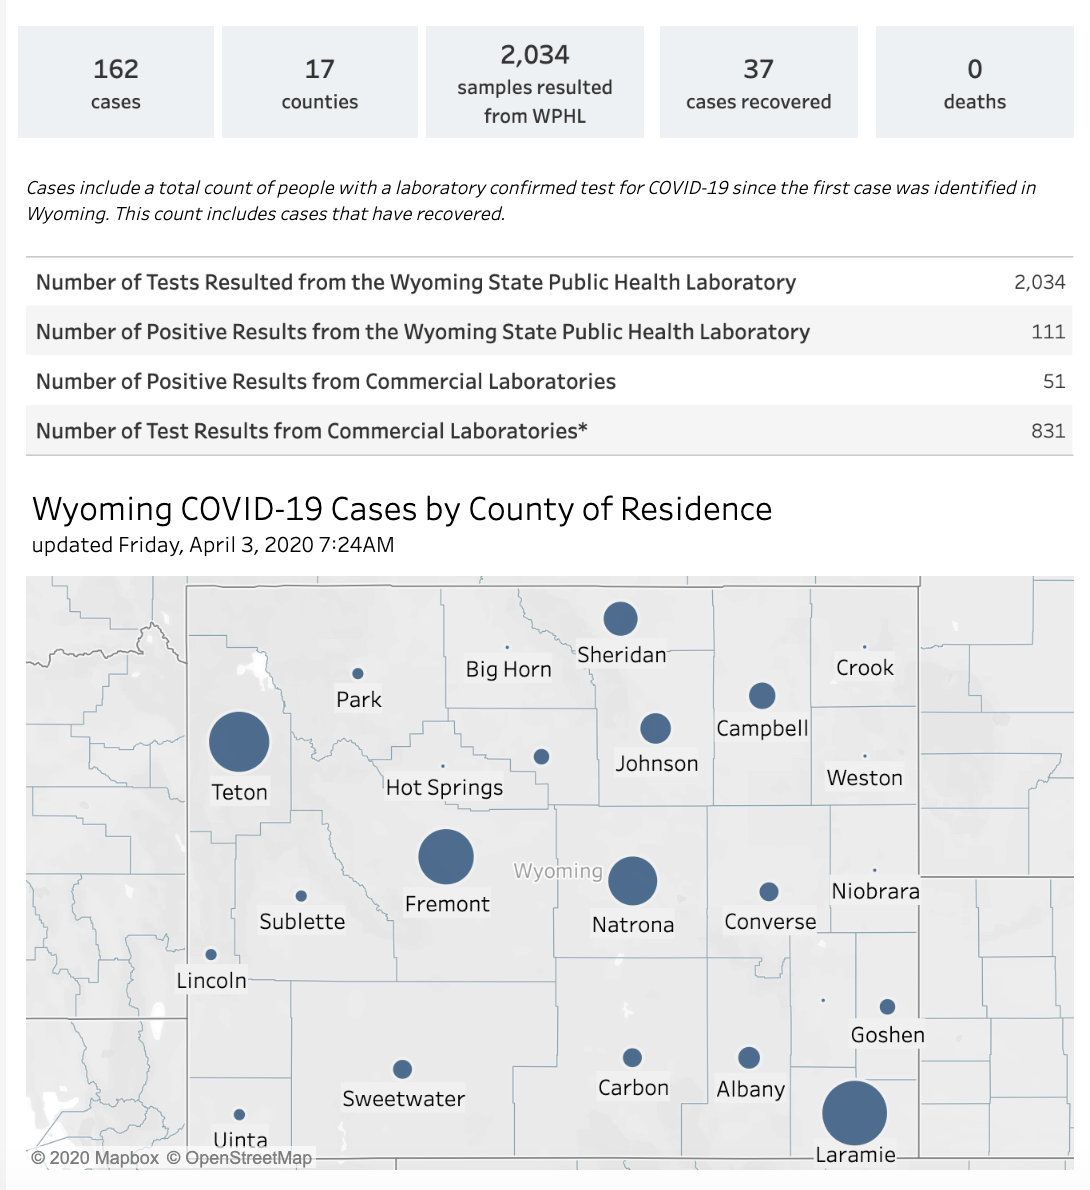
Wyoming Department of Health
Like California and Ohio, Wyoming’s Department of Health has created a dashboard in Tableau to track case data. But Wyoming gets much more granular with the kind of data it presents in the dashboard. In addition to more baseline data like hospitalizations and number of positive tests, Wyoming shows the number of cases by exposure risk: if a person had contact with a known case, or if they traveled domestically or abroad. It also shows a breakdown of the symptoms reported with cases, ranging from the most prevalent (cough) to the least (abdominal pain).
The way agencies decide to share data is “more an art than a science,” Spano says. Deciding what information to share with the public is actually not too different from the way doctors are taught to communicate with patients when they have bad news, Chaiken adds.
"You have to be strategic in how you deliver information—especially when it’s on something people don’t want to hear, you have to consider how much people will actually be able to take in.”
The different levels of detail in the public data presented by different agencies shows that these considerations are playing out before the data is made available.
View the dashboard.
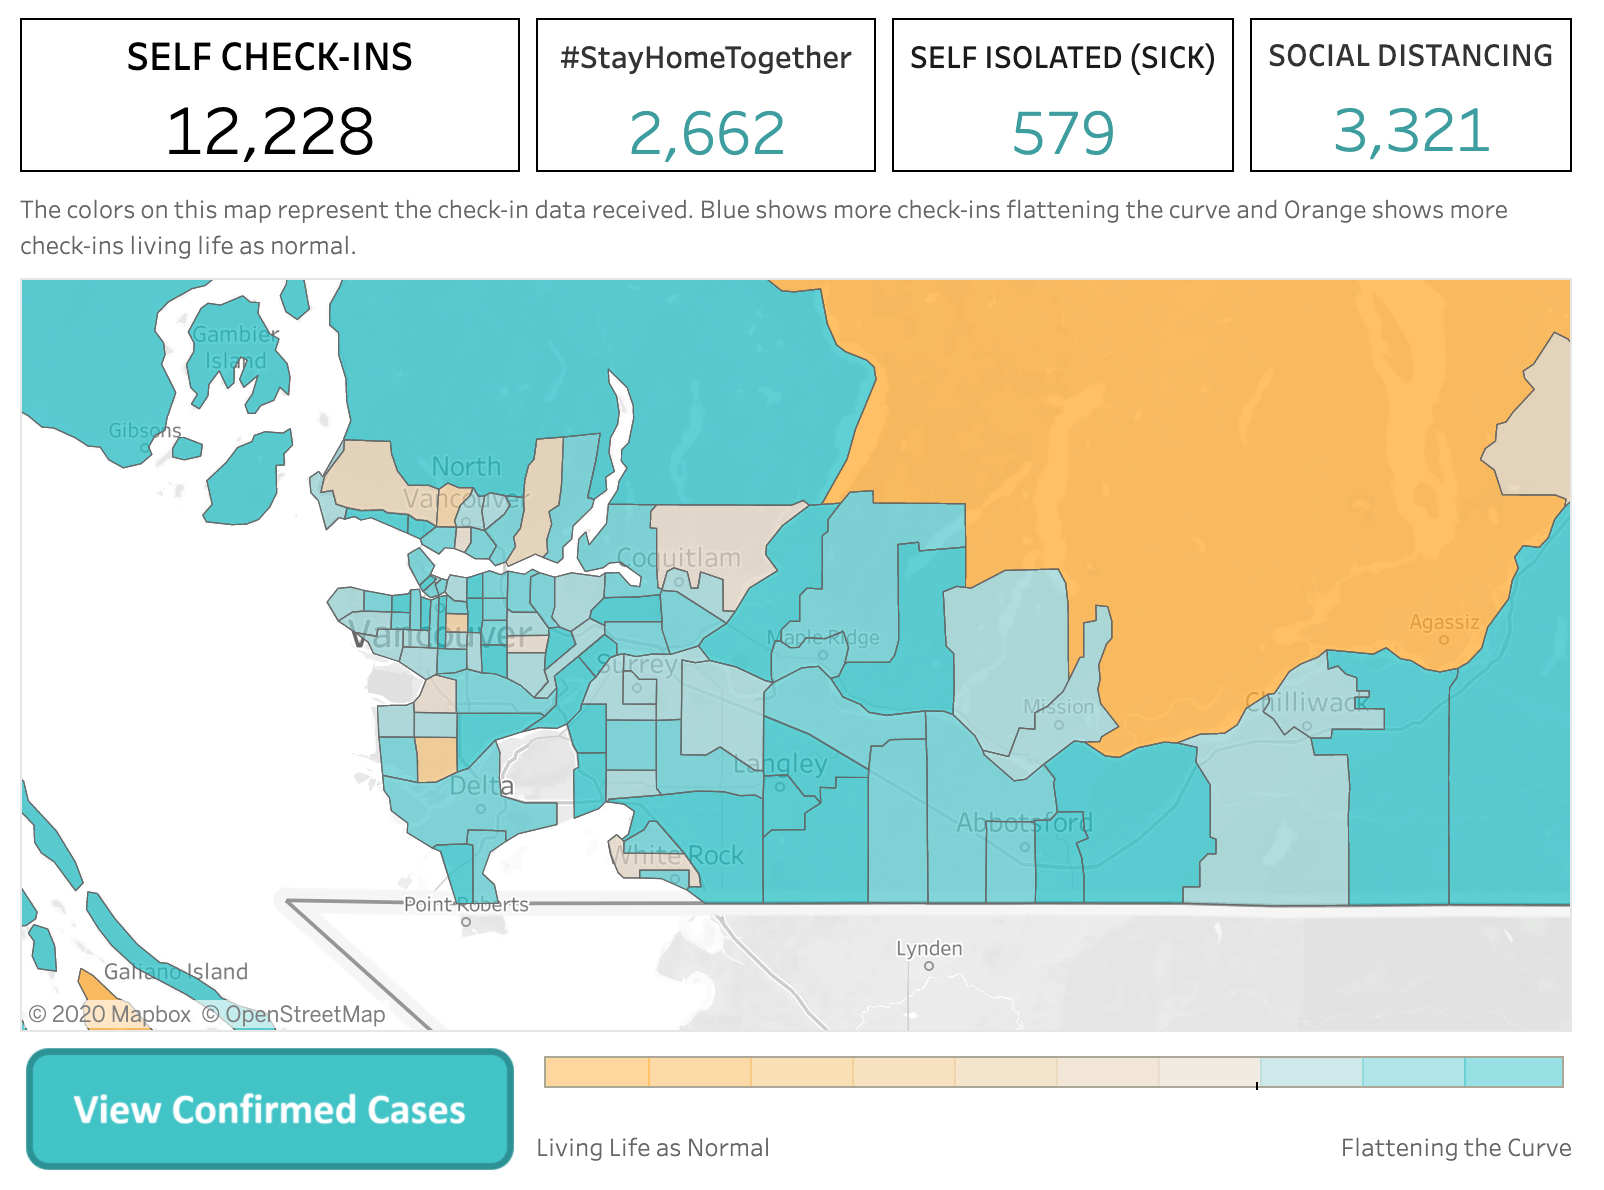
Fraser Health Authority (Vancouver, British Columbia)
The Fraser Health Authority—one of the five publicly funded health regions in the province of British Columbia—is taking a slightly different approach. Rather than thinking of data sharing as just the government communicating outward to the public, they wanted to create a way for people to add their data in. Leadership from FHA collaborated with the hackathon organization Bizhacks to create a portal where residents can do a daily check-in to share their status. People can report if they’re staying home, in self-isolation because they are sick, or if they’re practicing social distancing—leaving home for various reasons, but maintaining a safe distance from others and practicing good hygiene. A map created in Tableau reflects these check-ins against reported case data. The portal also links out to another resource, Helping Heroes, where residents can request or offer aid to others. The interactivity keeps people engaged in the crisis, and creates a sense of shared responsibility for others.
View the dashboard.
Check out this viz on Tableau Public to track where governments are using Tableau to share data on COVID-19:
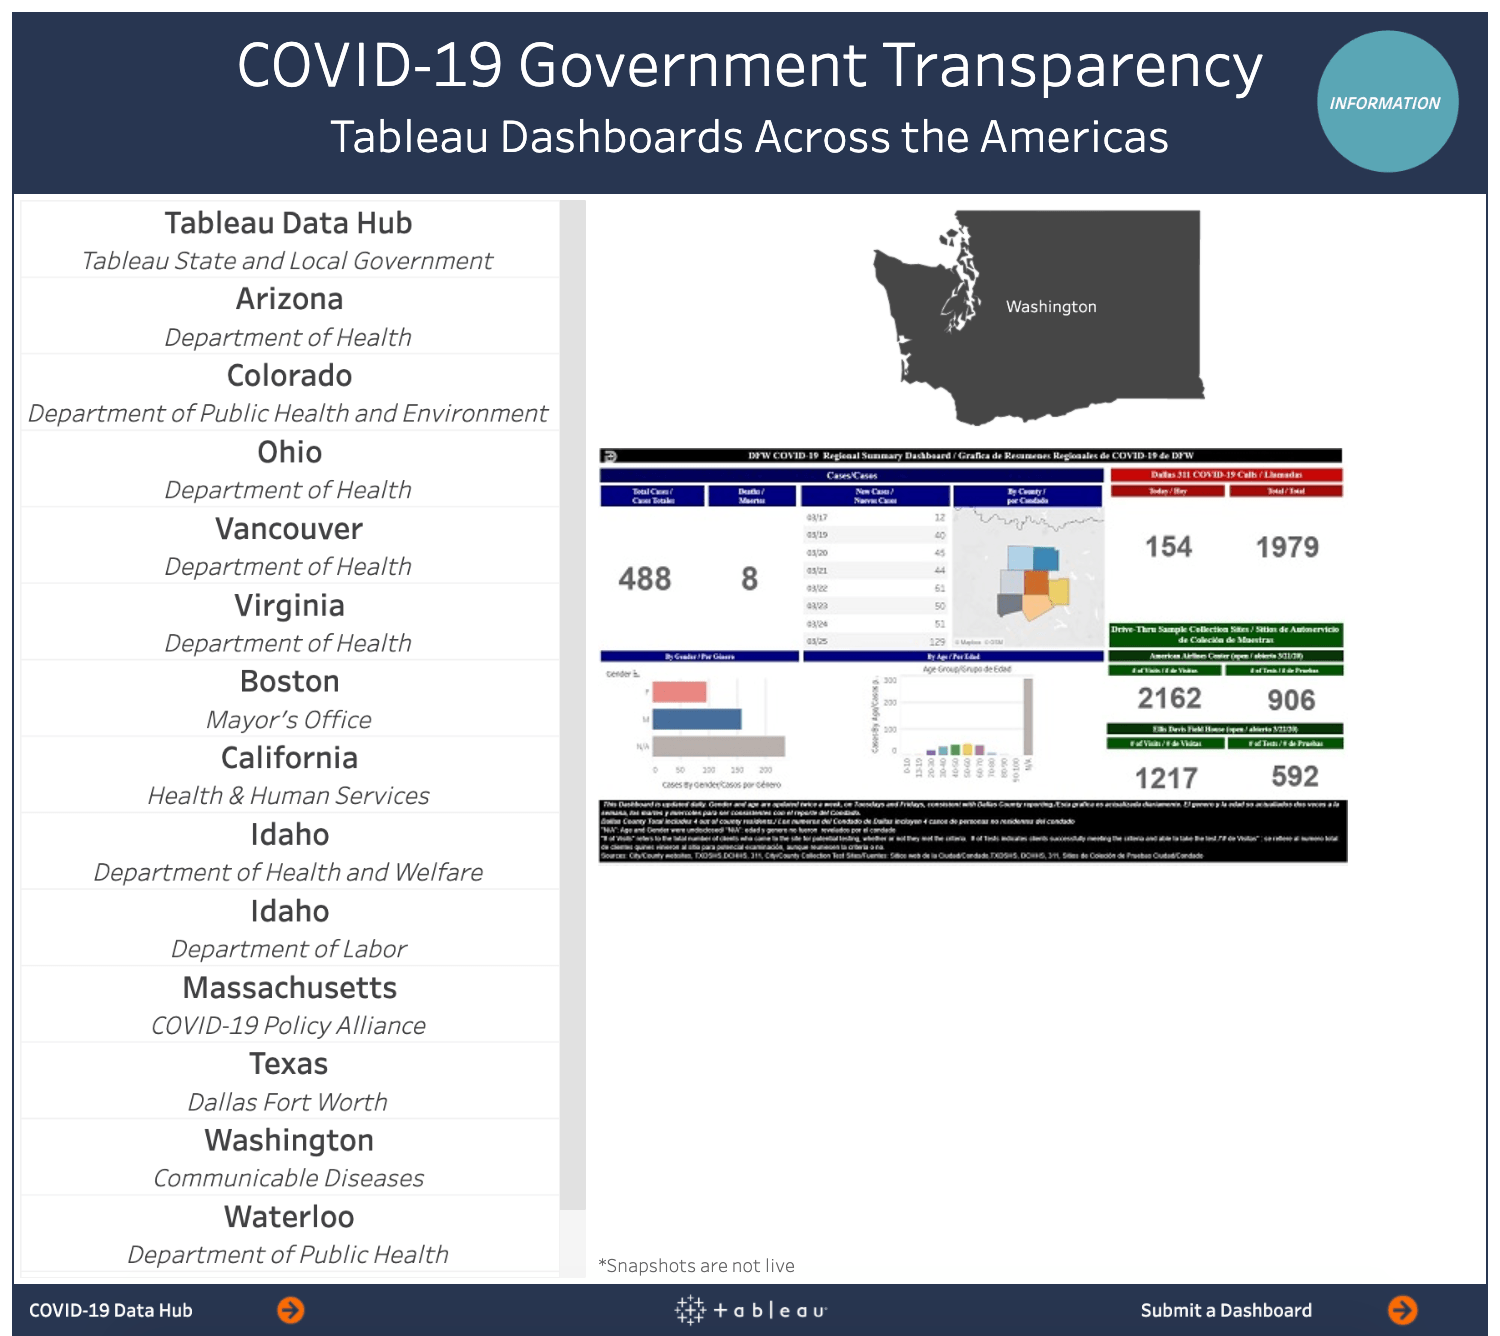
View the dashboard.
During the COVID-19 outbreak, data is a critical tool for understanding the pandemic and for informing life-saving policies. To learn more about data and the coronavirus, visit our COVID-19 Data Resource Hub.
เรื่องราวที่เกี่ยวข้อง
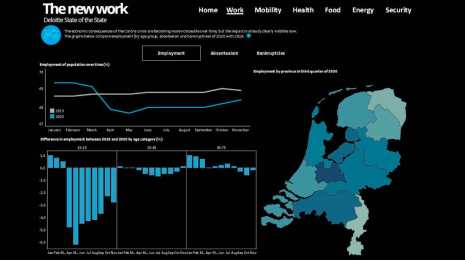
What we can learn from open data: COVID-19 in the Netherlands
 เมษายน 29, 2021

After a year of COVID-19 charts, eight data communication lessons learned
 เมษายน 19, 2021
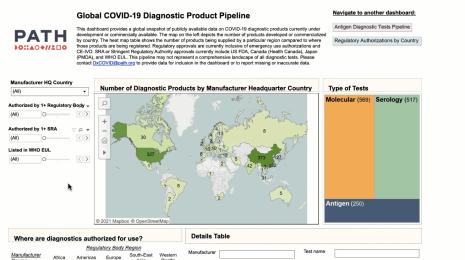
Data innovations in public health: PATH creates COVID-19 diagnostic test dashboard
เมษายน 2, 2021