Getting Started Guide
Tableau JavaScript API
Overview
You can use the Tableau JavaScript API to embed and integrate Tableau visualizations into your own web applications. You can display visualizations from Tableau Server, Tableau Public, and Tableau Cloud and programmatically interact with individual views. Using the Tableau JavaScript library, you can:
- Filter and set parameters on load - This is useful for loading the viz with the correct context given where the user is in your application or choices they have made.
- Create custom interfaces for interacting with the view - You can add your own dashboard controls that have the look and feel of your embedding application. Add HTML controls to filter the data displayed, select marks, or export images or data in various file formats.
- Create custom interactions - Combine calls to the Tableau JavaScript API methods to create interactions that would not be possible in Tableau alone. Use the API to respond to events in visualizations, to dynamically load and resize visualizations, to filter the data displayed, select marks that drive parameter changes on other sheets.
- Integrate Tableau with other systems - When you embed a visualization inside another system, you give users an opportunity to find insight from that visualization, and ideally, they will want to take action on that insight elsewhere in your application. With the JavaScript API, you can query data on the visualization, or listen to user events, and execute code that drives the appropriate action in your system.
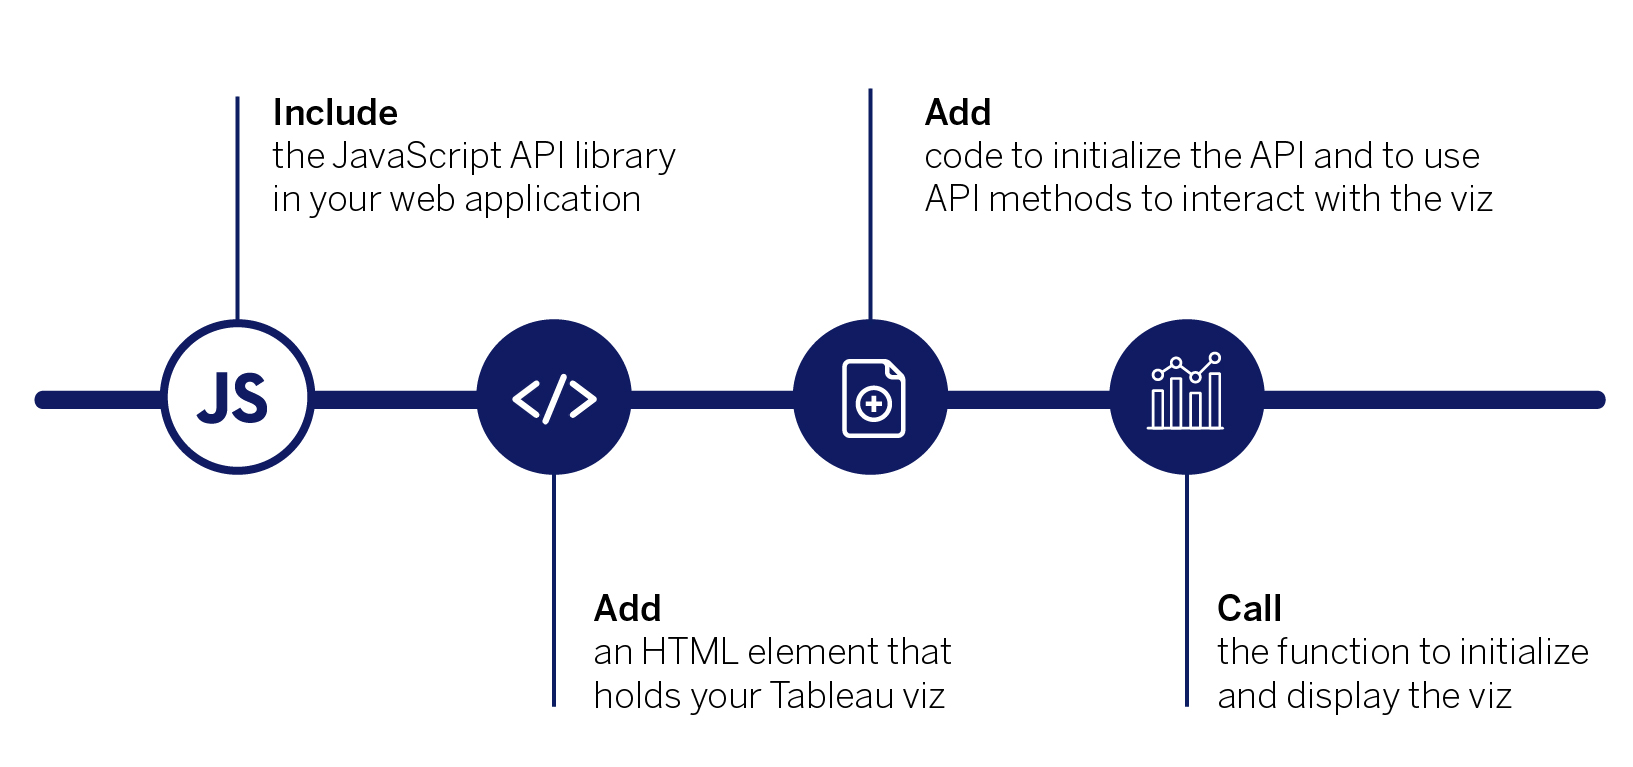
Let’s walk through the steps for embedding a Tableau visualization (the viz) in a web application.
- Include the Tableau JavaScript API library
- Add an HTML element to hold your Tableau viz
- Add code to initialize the API and to use API methods to interact with the viz
- Call the function to initialize and display the viz
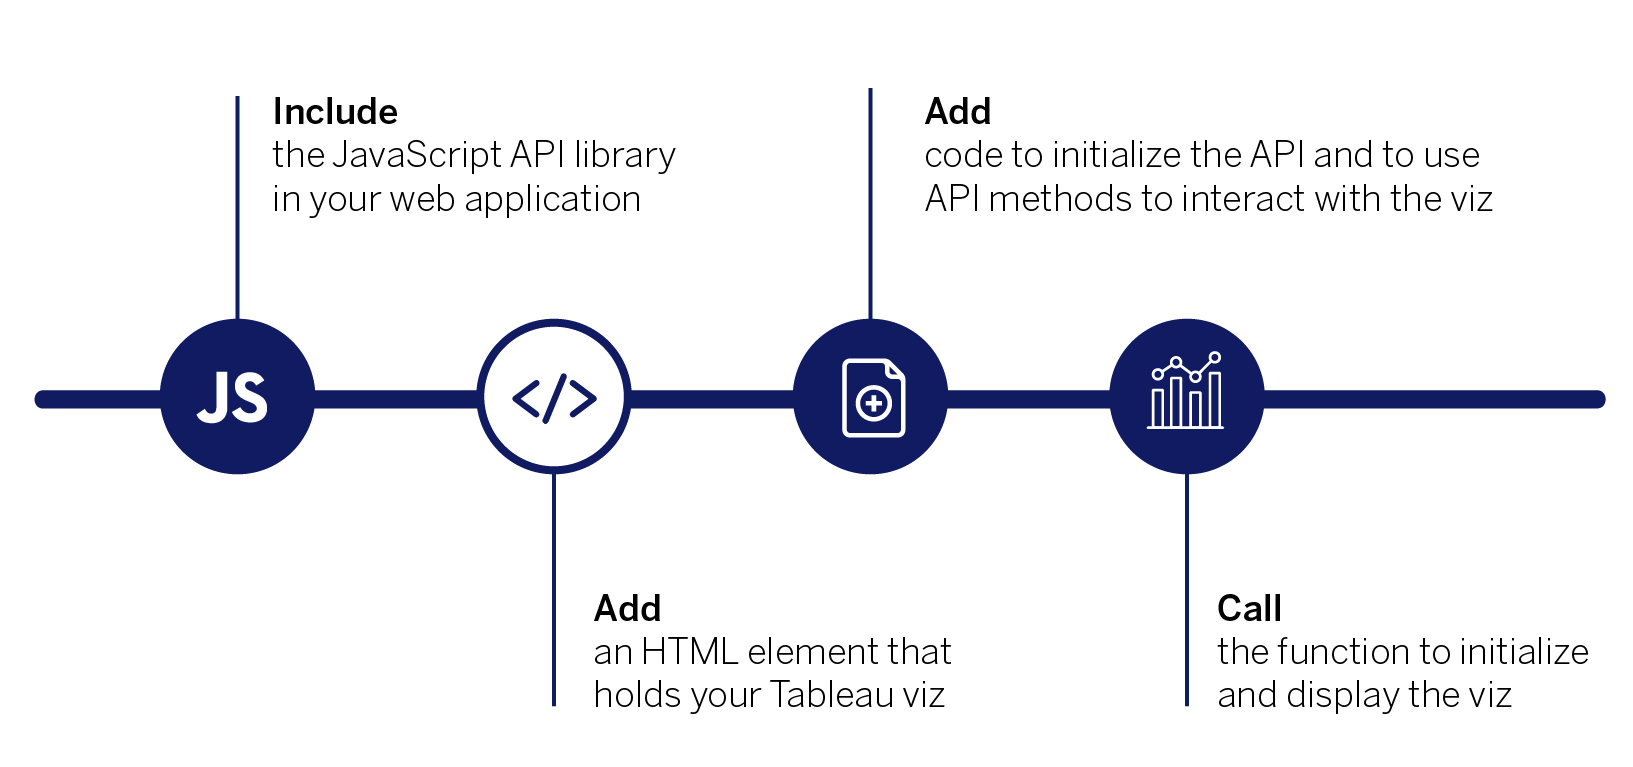
Getting started with the Tableau JavaScript API is easy. There’s nothing to download and no involved set up to go through before you begin. All you need is your web page or web application. Accessing the JavaScript library is simple. In the HTML code on your web page or application, just include the JavaScript API library file (tableau-2.min.js) from the Tableau (that is, the Tableau Server, Tableau Cloud, or Tableau Public instance) that hosts your visualizations.
<script src="https://YOUR-SERVER/javascripts/api/tableau-2.min.js"></script>
The JavaScript API file is a library that contains functions for interacting with the JavaScript API. The JavaScript API file is available in multiple versions, and each version of the Tableau JavaScript library corresponds to a specific version of Tableau Server. Additionally, for each version of the JavaScript API file, there is also a minified file that you can use in production environments to reduce the amount of data that browsers need to download. See Accessing the API.
To program with the Tableau JavaScript API you need to have access to Tableau Server, Tableau Cloud, or Tableau Public, and a published workbook on that server. If you are using Tableau Server, your web application shouldn’t be on the same computer as the server, but it needs to be able to access the server.
For example, say you want to embed a visualization from Tableau Public, you first just need to include the JavaScript API library file that is hosted on Tableau Public in your web application. In this case, we are using the minified file. The following shows the URL to the library.
<script type="text/javascript"
  src="https://public.tableau.com/javascripts/api/tableau-2.min.js">
</script>
For more information about the API and accessing specific versions of the library, see Accessing the API. For information about the requirements and permissions needed to view visualizations hosted on Tableau, see Tableau JavaScript API -Authentication.
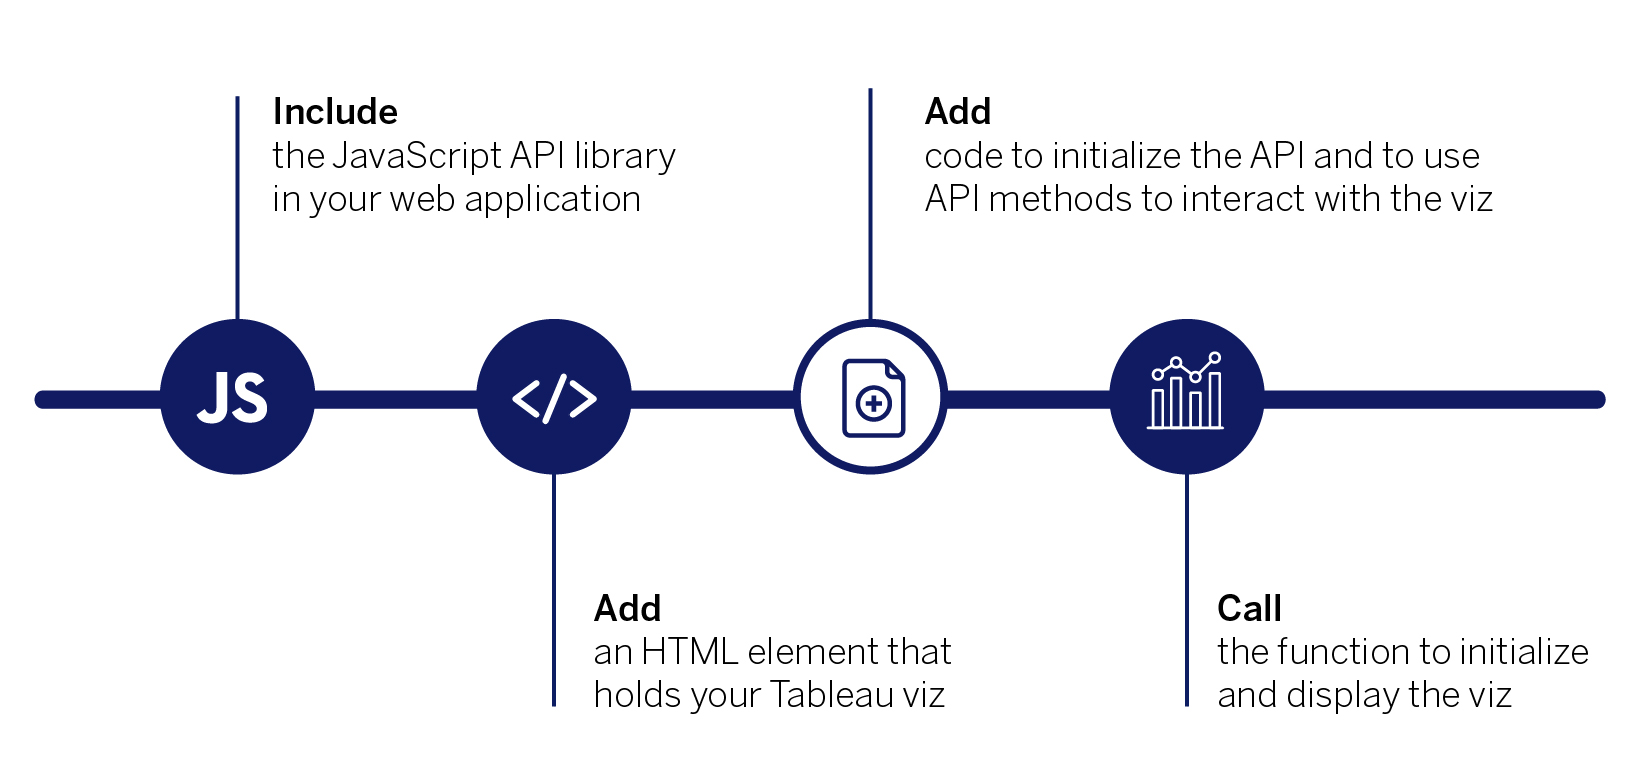
Now that you have the library, for the next step, you need to add a <div> element to your HTML page to host the Tableau visualization. In this case, we create a div element called vizContainer in the page body where you want to insert the Tableau visualization. You can set the width and height for the div element.
<body>
    <div id="vizContainer" style="width:800px; height:700px;"></div>
</body>
Next, we need to write a function in a JavaScript file to display the visualization. The Tableau JavaScript API uses an object model. The entry point into this object model is to instantiate a new Viz object as follows:
var viz = new tableau.Viz( /* params omitted */ );
Creating a new Viz object generates the HTML code necessary to embed a Tableau visualization in your web application. To instantiate a new Viz object, call the Viz constructor and pass a reference to the div container on the HTML page. You also provide the URL of the visualization on Tableau Server, Tableau Cloud, or Tableau Public, and you can specify a set of options.
Pro Tip - Getting the URL to the viz
To find the URL for a view on Tableau Server or Tableau Cloud, click Share on the toolbar and select Copy Link from the Share View dialog box. For Tableau Public, copy the URL for the view from the address bar in your browser.
For example, the following JavaScript code creates a function called (initViz()) to initialize the Viz object. This function embeds a Tableau view in the div element called vizContainer. For the URL, the example specifies a visualization on Tableau Public. In addition, this code sets a couple of options for the Viz object. The first specifies that any tabs in the workbook should be hidden. You can use these options to specify the size (height and width) of the view, to show or hide the toolbar, or set filters on the view. For information about all the options you can specify, see VizCreateOptions record in the Tableau JavaScript API.
<script type="text/javascript">
    function initViz() {
      var containerDiv = document.getElementById("vizContainer"),
          url = "https://public.tableau.com/views/RegionalSampleWorkbook/Storms",
          options = {
            hideTabs: true,
            onFirstInteractive: function () {
            console.log("Run this code when the viz has finished loading.");
            }
          };

      var viz = new tableau.Viz(containerDiv, url, options);
      // Create a viz object and embed it in the container div.
      }
</script>
This example also specifies the onFirstInteractive() callback function. This is a function that is called once the Tableau view has been initialized and loaded. You can use the callback to call other functions, such as functions that add event listeners, or functions that set up interactive filters, or functions that perform other actions, based upon activity taken by users of your web application. In this example, the function writes a message to the console. If you open the debugging tools for your browser, you will see this message in the console window after the Tableau viz has loaded.
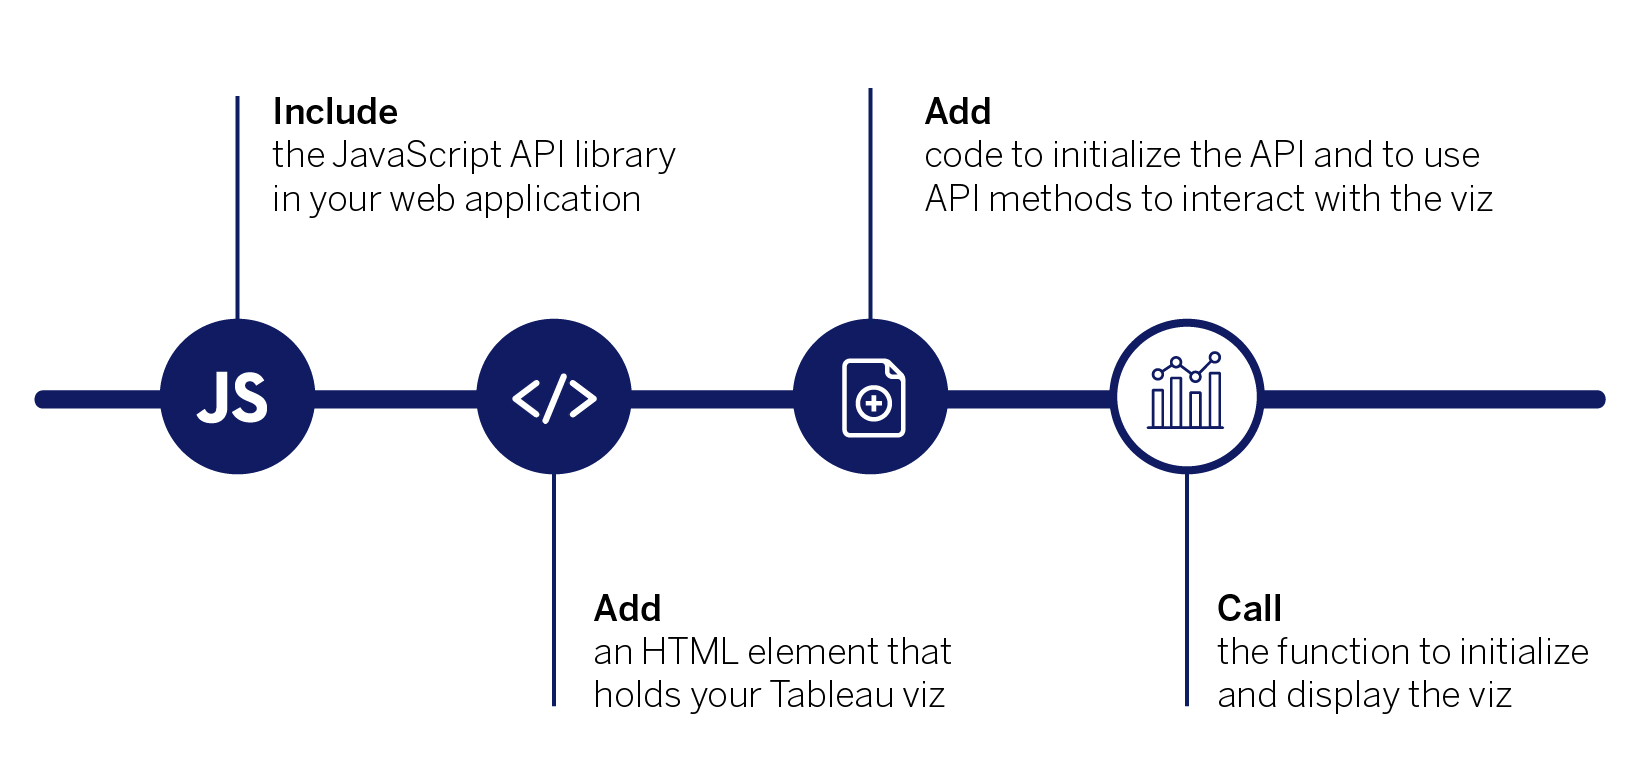
After you create your function to create and initialize the Viz object, you just need to call that function from your web application. One way to do that is to use the JavaScript onload event attribute to the HTML <body> element to call your function when the HTML page is fully loaded (all script files, images, and resources).
For example, to use the intitViz() function we defined in the previous step, you might have HTML code that looks like the following.
<body onload="initViz();">
    <div id="vizContainer" style="width:800px; height:700px;"></div>
</body>
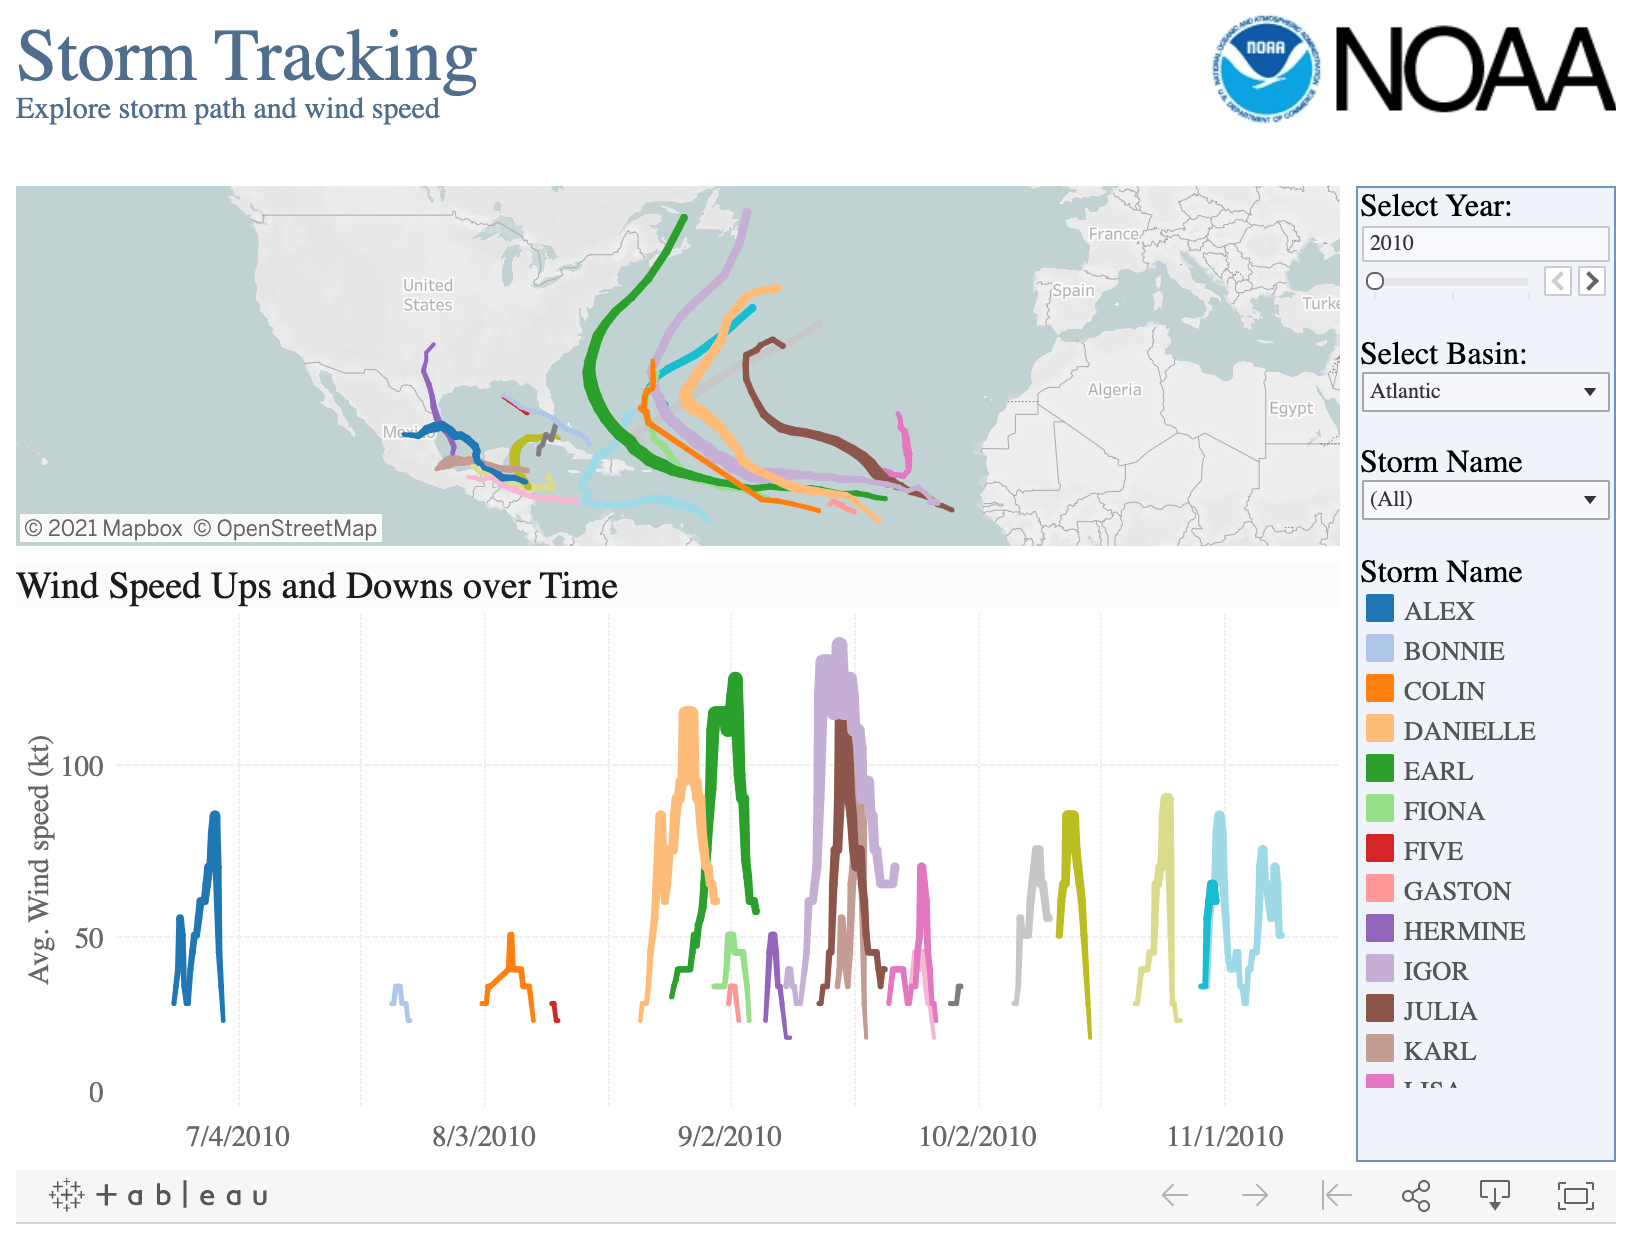
When the HTML page loads in the browser, the initViz() function gets called and creates the new Viz object and loads the interactive Tableau visualization. That’s all there is to it!
Here’s what it looks like:
Here’s the complete source code for the web page:


Senaste uppdatering: 14 September, 2021