DataFam Roundup: July 24-28, 2023


Welcome! Dig into this week's DataFam Roundup—a weekly blog that brings together community content all in one post. As always, we invite you to send us your content—and the DataFam content from your peers that have inspired you! Find the content submission form here.
Community Highlight
To recognize new and consistent Tableau contributors—we’re excited to have a section within the weekly DataFam Roundup called the Tableau Community Highlight. Find out how to get involved.

Sabri Aouani, Data Analyst
Tunis, Tunisia
Sabri Aouani is a Data Analyst. After starting a new job in late 2021, Sabri taught himself Tableau using YouTube. Since then, Sabri has continued to sharpen his Tableau skills by participating in community projects like #MakeoverMonday and more actively posting on Tableau Public. Over the past 4 months, Sabri has also shared over 100 Tableau Tips on Linkedin.
On Linkedin, Sabri shares written tips and video tutorials. One of Sabri’s most popular Linkedin posts shows users how to create a candlestick chart, a financial chart used to represent the movement of an asset's price over time. After reaching this milestone, Sabri has also ventured into creating YouTube videos for longer form content as well.
Sabri is inspired by members of the DataFam who share Tableau content with the intention to teach and help other users. He appreciates the consistency with which content is produced by many of the content creators in the DataFam and Sabri aims to follow in their footsteps and regularly share content. Sabri finds inspiration for the tips he shares from his own learnings. When he encounters a problem and solves it, he creates a tutorial in hopes of helping others who may face the same problems.
Connect with Sabri on Linkedin, Tableau Public, and on his YouTube channel.
DataFam content
Dive into content created by the Tableau Community:
-
Priya Yogendra Rana: Resizing Tableau Dashboard Objects
-
Avery Smith, Data Career Jumpstart: Hiring Manager’s Secrets to Getting The Job as a Data Analyst w/ Megan McGuire
-
Adam Mico: Embarking on the Data Analytics Odyssey
-
Donna Coles: Re-Viz : Blind leading the blind
-
dr_transformaçãodigital: Como Inserir dados no Tableau | Tableau Desktop
-
Lee Feinberg: Do you use filters on your #dashboards?
-
Driven by Data: The Podcast: S3 | Ep 36 | The Role of Data Visualisation in Driving Change and Realising Value with Andy Cotgreave, Senior Data Evangelist at Tableau
-
Kieran Adair on LinkedIn: Did you know you can create calculated fields in #Tableau by dragging text into the data pane?
-
Chitrang Dave, The Data Leadership Collaborative: 5 Crucial AI Skills for Today’s Data Leaders
-
Marcelo Has: Tableau Data Dictionary
-
Gurpreet Singh, Data Viz Canvas: How to create radial heat map in Tableau
-
Becky O'Connor: How to analyze geospatial Snowflake data in Streamlit
-
Dawn Harrington, Tech Tips Girl: Rolling Sum Calculations
-
Andy Kriebel: Why everyone is going crazy over climate change. Here's the answer
-
Jill Brown, Andy Cotgreave, Joey Cherdarchuk, Sarah Bartlett, Data Visualization Society: Fireside Chat: Data Viz Insights through Feedback and Critique
-
Steve Wexler, Jeff Shaffer, Andy Cotgreave, and Amanda Makulec: Chart Chat 43
-
Andy Cotgreave: These three versions show why, and how a line chart is the better choice for this purpose
-
Will Sutton: Charting New Territory in Tableau: Football Shot Zones, Made Possible by CJ Mayes | Behind the Viz
-
Tim Ngwena, Tableau Tim: I still hate Tableau hacks
-
Ken Flerlage, The Flerlage Twins: Synchronized Scrolling in Tableau
-
Marc Reid: Multiple Values and Wildcard Match Tableau Filters
Team Tableau
Upcoming events and community participation
-
VizIt Sydney is happening October 31 - November 1! A Tableau Community Conference, by the Datafam for the Datafam. Sign up to be the first to know when registration opens and submit to be a speaker now
-
Michelle Frayman, Zak Geis and Nicole Klassen: Viz Feedback Office Hours
-
Data Book Club: This summer, the Data Book Club is reading Living in Data: A Citizen's Guide to a Better Information Future by Jer Thorp.
-
Community Calendar and Upcoming Events: stay up-to-date on the latest Women in Dataviz events and other data visualization-related events. If you'd like to submit an event to the calendar, please fill out this form.
Vizzes
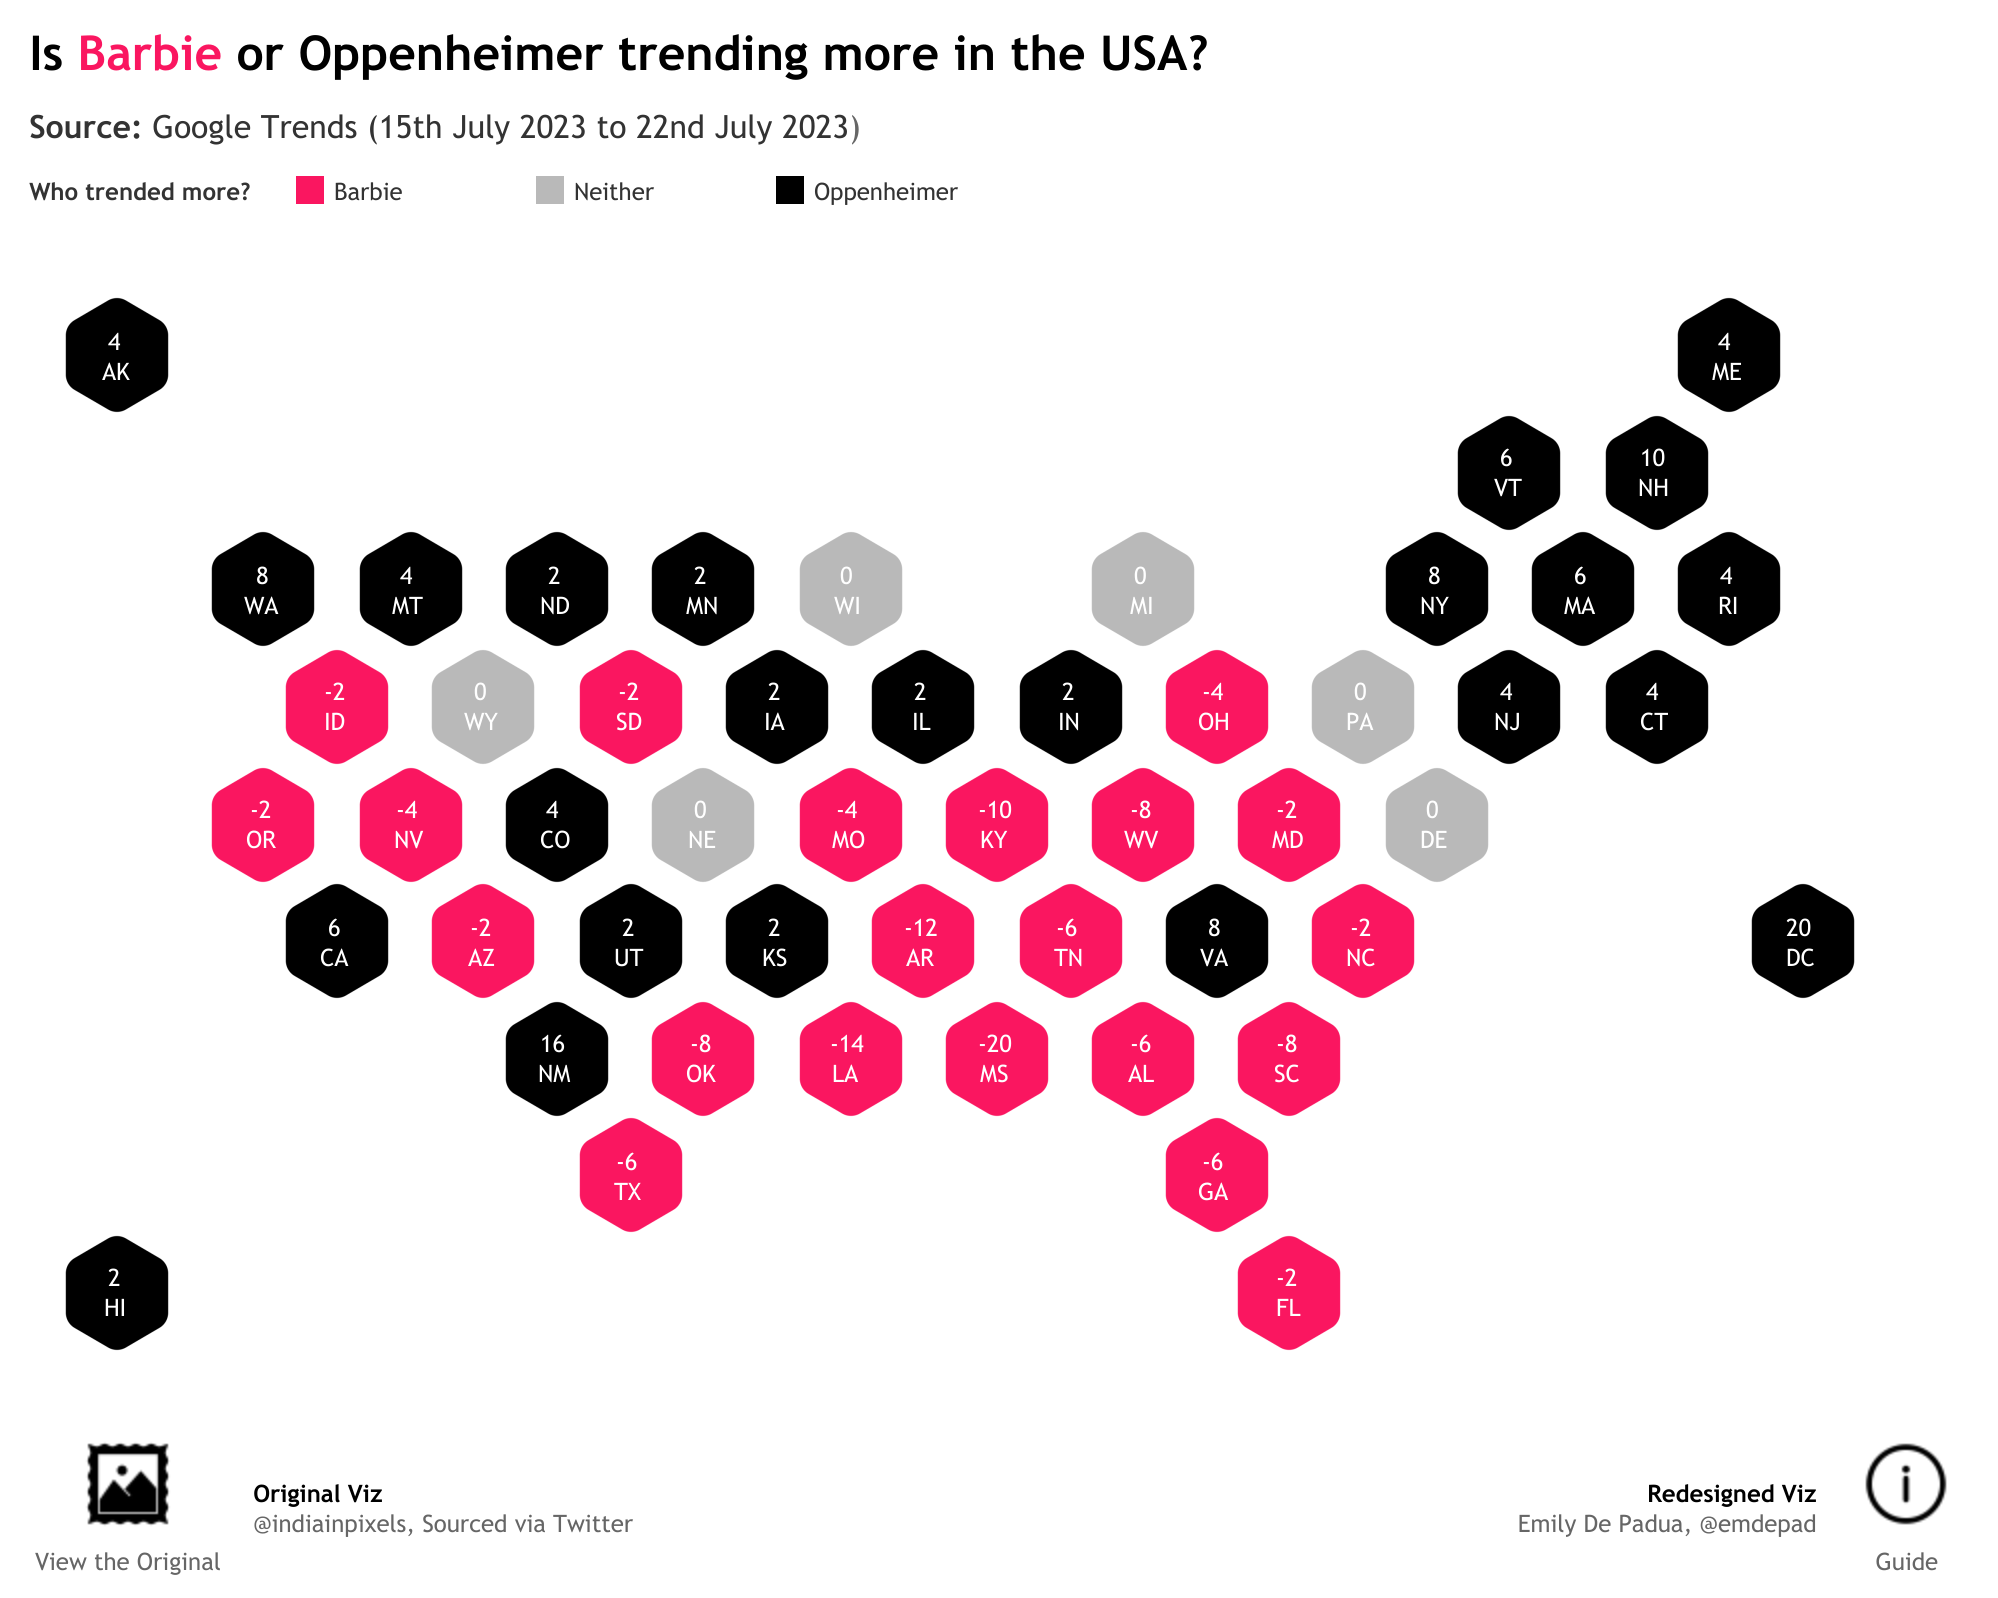
Emily De Padua: Barbenheimer Re-Viz It
See the latest Viz of the Day, trending vizzes, featured authors, and more on Tableau Public.
Check out some inspirational vizzes created by the community:
-
Zach Bowders: Nolan
-
Emily De Padua: Barbenheimer Re-Viz It
-
Pablo Gomez: El poder de las capas y los elementos flotantes
-
Darragh Murray: Here Comes the Sun - Mapping the Global Uptake of Solar Power
Community Projects
Back 2 Viz Basics
A bi-weekly project helping those who are newer in the community and just starting out with Tableau. Not limited just to newbies!
Web: Back 2 Viz Basics
Twitter: #B2VB
Week 14: Write a Clear Title
Workout Wednesday
Build your skills with a weekly challenge to re-create an interactive data visualization.
Web: Workout Wednesday
Twitter: #WOW2022
Week 30: Can you build a dynamic drill down scatterplot in one view?
Makeover Monday
A weekly social data project.
Web: Makeover Monday
Twitter: #MakeoverMonday
Week 30: Daily Sea Ice Extent
Preppin' Data
A weekly challenge to help you learn to prepare data and use Tableau Prep.
Web: Preppin’ Data
Twitter: #PreppinData
Week 30: % Difference From
DataFam Con
A monthly challenge covering pop culture and fandoms.
Web: DataFam Con
Twitter: #DataFamCon
April 2023: Kids Month!
EduVizzers
A monthly project connecting real education data with real people.
Web: Eduvizzers
July 2023: NYC SAT (College Board) 2010 School Level Results
Games Night Viz
A monthly project focusing on using data from your favorite games.
Web: Games Nights Viz
Twitter: #GamesNightViz
Level 6: The Final Boss
Iron Quest
Practice data sourcing, preparation, and visualization skills in a themed monthly challenge.
Web: Iron Quest
Twitter: #IronQuest
Advanced Chart Types
Storytelling with Data
Practice data visualization and storytelling skills by participating in monthly challenges and exercises.
Web: Storytelling with Data
Twitter: #SWDChallenge
July 2023: bring on the bubbles
Project Health Viz
Uncover new stories by visualizing healthcare data sets provided each month.
Web: Project Health Viz
Twitter: #ProjectHealthViz
June 2023: Funding for Research for Various Conditions and Diseases
Diversity in Data
An initiative centered around diversity, equity & awareness by visualizing provided datasets each month.
Web: Diversity in Data
Twitter: #DiversityinData
May 2023: Mental Health Awareness Month and LGBTQ+ Representation in film
Sports Viz Sunday
Create and share data visualizations using rich, sports-themed data sets in a monthly challenge.
Web: Sports Viz Sunday
Twitter: #SportsVizSunday
January 2023: Is it a Sport or a Game?
Viz for Social Good
Volunteer to design data visualizations that help nonprofits harness the power of data for social change.
Web: Viz for Social Good
Twitter: #VizforSocialGood
June 9 - July 18, 2023: Gord Downie & Chanie Wenjack Fund
Real World Fake Data
Create business dashboards using provided data sets for various industries and departments.
Web: Real World Fake Data
Twitter: #RWFD
Session 5: Diversity Score Card
Data Plus Music
A monthly project visualizing the data behind the music we love!
Web: Data Plus Music
Twitter: #DataPlusMusic
Relaterade berättelser

DataFam Roundup June 2026

DataFam Roundup May 2026

Iron Viz 2026: Read Between the Data
 28 Maj, 2026