DataFam Roundup November 2025


Welcome! Dig into this month's DataFam Roundup—a monthly blog that brings together community content all in one post. As always, we invite you to send us your content—and the DataFam content from your peers that have inspired you! To send us your content, join the Tableau Community workspace on Slack and join the #community-share channel.
Community Highlight
To recognize new and consistent Tableau contributors—we’re excited to have a section within the monthly DataFam Roundup called the Tableau Community Highlight. Find out how to get involved.

Chie Sakaki, BI Analyst
Kanagawa, Japan
Chie Sakaki is a BI Analyst in the financial industry, developing dashboards for clients. Outside of work, she channels her passion for data into art using Tableau, drawing inspiration from Japanese culture and her personal experiences. Chie built her Tableau expertise not just by learning the tool, but by mastering the art of helping people understand data through the rigorous DATA Saber program. Now, she actively contributes to the community by sharing her knowledge through Tableau Public, social media, and her blog, viewing this as an opportunity to pay forward the kindness and insights she has received and support others on their journey.
In the Tableau Community, Chie’s favorite part of being involved is the kindness and warmth of the DataFam and how people from diverse backgrounds connect through the shared language of data visualization. Chie also serves as the host for VizSpace, a unique exhibition that presents Tableau creations specifically as art, encouraging dialogue and sparking meaningful connections beyond traditional data reporting. Looking ahead, she is excited to explore information design, storytelling, and UI/UX, recognizing that as AI streamlines analytical work, the creative and intuitive aspects—the essence of human contribution—will become even more crucial in the world of data.
Connect with Chie on Linkedin and Tableau Public.
DataFam Content
- Adam Mico: Nominations are now open for #DataFamRisingStars2026
- Lahav Ararat: Tableau <> Snowflake Connection (Okta username & password)
- Rod Sardari: Geocoding Using Census GEO IDs in Tableau | GIS & Data Visualization Tutorial
- Johan de Groot: Why is COUNTD so slow – and how can I fix this?
- Tarun Gupta: Tableau Next Tips #1 : Tableau Next Edition
- Deepak Holla:
- Tableau Basic Terminology: What are Marks!
- Tableau Prep Builder Topic: Filter options available in the Input Step
- Dimensions vs Measures in Tableau: The Simplest Explanation You'll Ever Need"
- How Tableau Desktop Detects Data Types (and Why It Matters More Than You Think)
- Tableau Basic Terminology: What are Shelves!!!
- Easy way to Copy Worksheet Formatting || #Tableau "Quick Tips" Series
Team Tableau Content
- Tableau 2025.3 is now available!
- Inside Track: Roadmap Session on Dec 8, 9 AM PT, 12 PM ET
- Join the Tableau Hackathon, enter by Jan 12, 2026
- Explore the new State of Data and Analytics Report
Visualizations
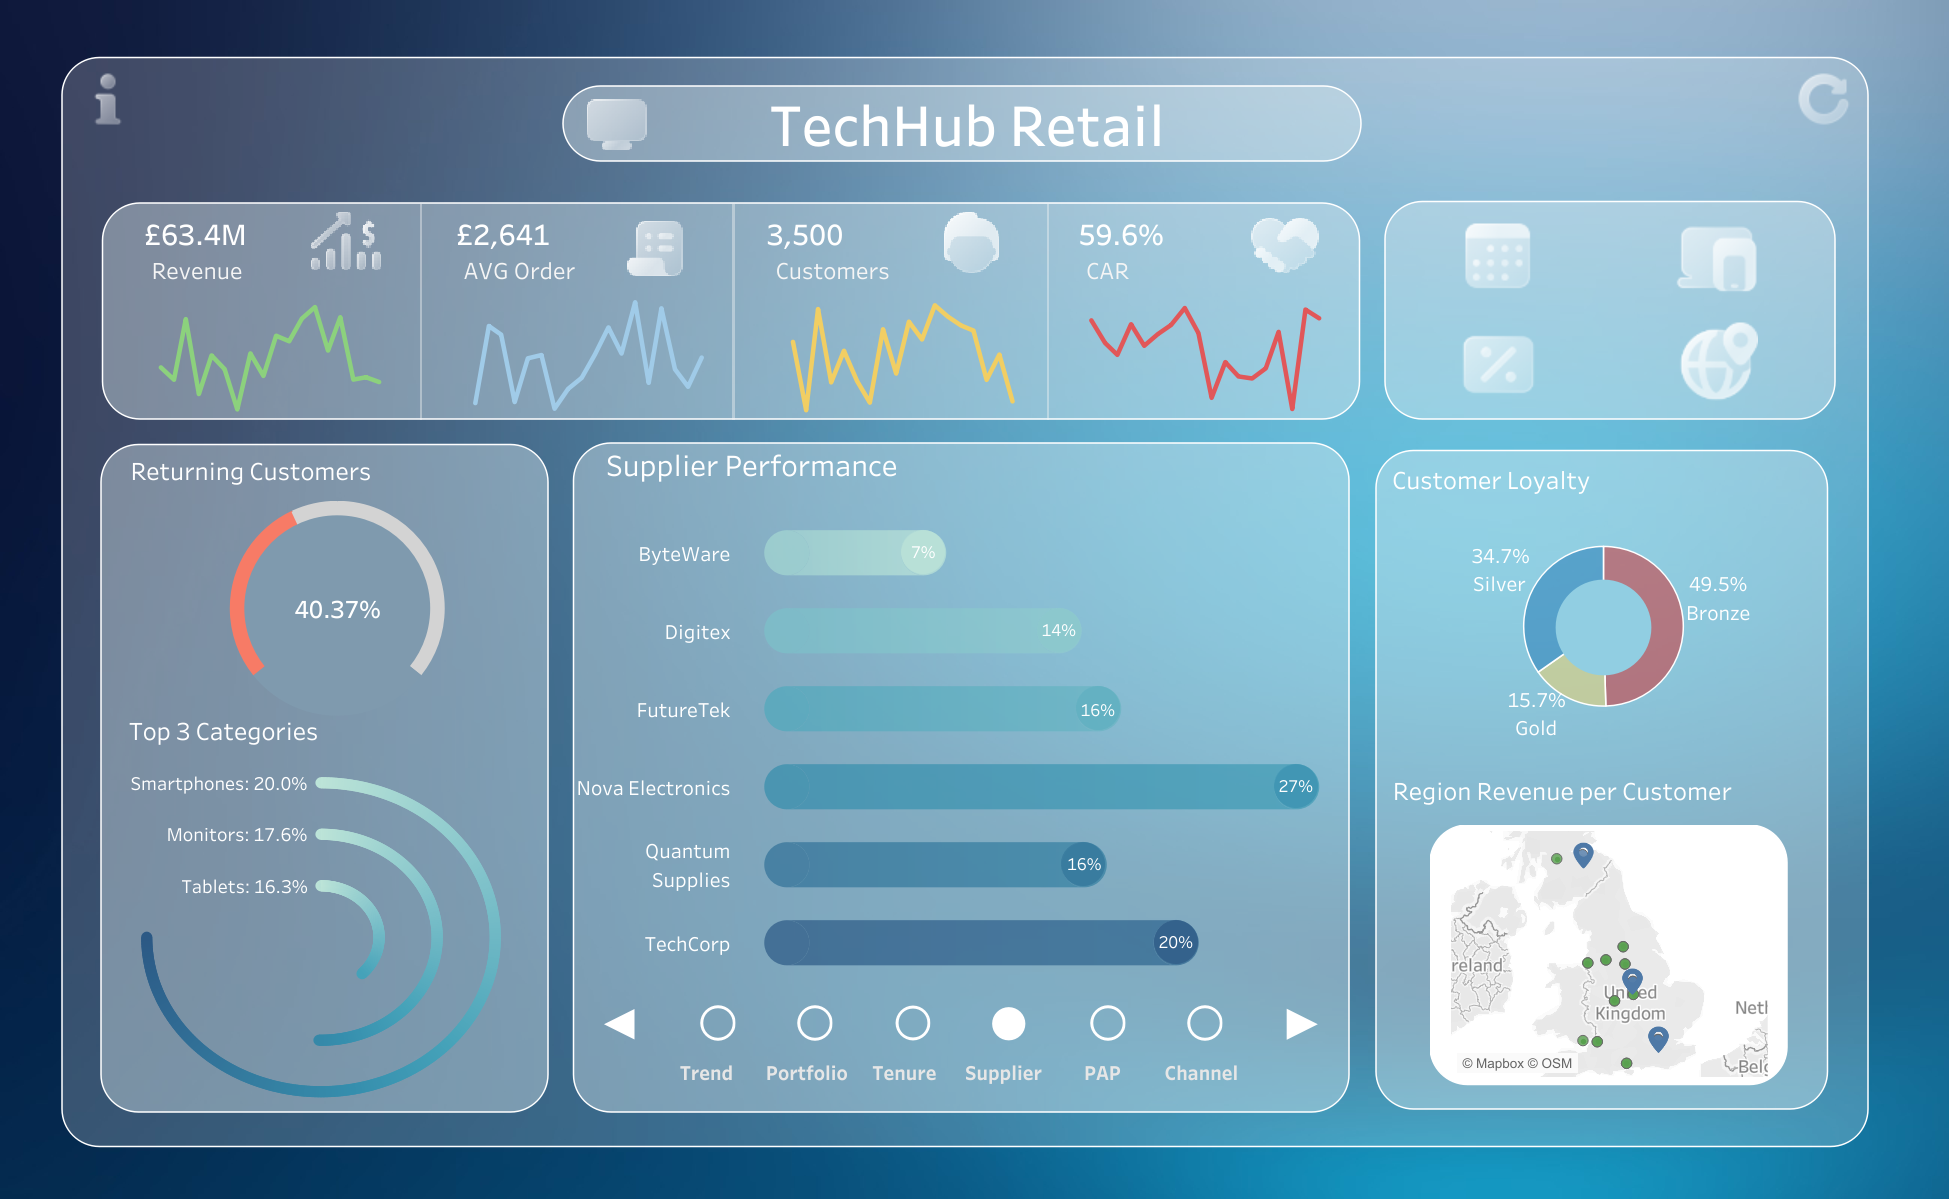
Zahra Hayati: TechHub Retail
See the latest Viz of the Day, trending vizzes, featured authors, and more on Tableau Public.
Check out some inspirational vizzes created by the community:
- Jacob Rothemund: Netflix vs Spotify Historical Stock Price Re-visited
- Matthias Giger: Resolved Issues Tableau Desktop, Prep and Server
- Ojoswi Basu: Triangles on Bars Map Layers
- Victory Omovrah & Kimly Scott: Victory & Kimly's Tableau Hackathon
- Matt Huff: UO vs OSU
- Rod Sardari, GISP, Ph.D.: 30-Day Map Challenge 2025 Using ArcGIS Living Atlas of the World
- Zahra Hayati: Earthquake Dashboard
- Miles Crow:
Community Projects
Back 2 Viz Basics
A bi-weekly project helping those who are newer in the community and just starting out with Tableau. Not limited just to newbies!
Web: Back 2 Viz Basics
X: #B2VB
Workout Wednesday
Build your skills with a weekly challenge to re-create an interactive data visualization.
Web: Workout Wednesday
X: #WOW2022
Preppin' Data
A weekly challenge to help you learn to prepare data and use Tableau Prep.
Web: Preppin’ Data
X: #PreppinData
Makeover Monday
Create business dashboards using provided data sets for various industries and departments.
Web: Makeover Monday
X: #MakeoverMonday
Data ChangeMakers
Volunteer to design data visualizations that help nonprofits harness the power of data for social change.
Web: Data ChangeMakers
Visual Climate
Collaborate and share climate data.
Web: Visual Climate
X: #VisualClimate
DataFam Con
A monthly challenge covering pop culture and fandoms.
Web: DataFam Con
X: #DataFamCon
EduVizzers
A monthly project connecting real education data with real people.
Web: Eduvizzers
Games Night Viz
A monthly project focusing on using data from your favorite games.
Web: Games Nights Viz
X: #GamesNightViz
Iron Quest
Practice data sourcing, preparation, and visualization skills in a themed monthly challenge.
Web: Iron Quest
X: #IronQuest
Storytelling with Data
Practice data visualization and storytelling skills by participating in monthly challenges and exercises.
Web: Storytelling with Data
X: #SWDChallenge
Project Health Viz
Uncover new stories by visualizing healthcare data sets provided each month.
Web: Project Health Viz
X: #ProjectHealthViz
Diversity in Data
An initiative centered around diversity, equity & awareness by visualizing provided datasets each month.
Web: Diversity in Data
X: #DiversityinData
Sports Viz Sunday
Create and share data visualizations using rich, sports-themed data sets in a monthly challenge.
Web: Sports Viz Sunday
X: #SportsVizSunday
Real World Fake Data
Create business dashboards using provided data sets for various industries and departments.
Web: Real World Fake Data
X: #RWFD
Data Plus Music
A monthly project visualizing the data behind the music we love!
Web: Data Plus Music
X: #DataPlusMusic
BizViz52
A weekly project centered around designing business dashboards.
Web: BizViz52
X: #BizViz52
Histórias relacionadas

DataFam Roundup June 2026

DataFam Roundup May 2026

Iron Viz 2026: Read Between the Data
 28 Maio, 2026