DataFam Roundup March 2026


Welcome! Dig into this month's DataFam Roundup—a monthly blog that brings together community content all in one post. As always, we invite you to send us your content—and the DataFam content from your peers that have inspired you! To send us your content, join the Tableau Community workspace on Slack and join the #community-share channel.
Community Highlight
To recognize new and consistent Tableau contributors—we’re excited to have a section within the monthly DataFam Roundup called the Tableau Community Highlight. Find out how to get involved.

Mariaynes Rodríguez Hernández, Lecturer at Tecnológico de Monterrey
Monterrey, Mexico
Mariaynes Rodríguez Hernández is an educator who teaches data visualization in the business field at the professional and graduate levels. Her journey began with a foundational data analysis course, which she has since expanded into a mastery of the craft by learning from other community legends. Mariaynes doesn’t just teach technical skills; she enjoys building bespoke graphics from scratch and enhancing them with illustrations. By blending business intelligence with artistic storytelling, she creates impactful dashboards that shed light on critical social and economic issues.
Deeply rooted in the DataFam, Mariaynes thrives on the culture of sharing and mutual growth that defines the Tableau Community. She stays connected with others through the Tableau Community Slack Workspace and virtual Tableau User Groups, where she actively shares her teaching methodologies and project inspirations. Her mission is to onboard the next generation of data enthusiasts, often using her own Tableau Public portfolio to show her students the art of the possible. Beyond the classroom, she is expanding her reach to LinkedIn and social platforms like TikTok and Instagram, where she shares quick Tableau tips to help others find their own creative spark in the world of data.
Connect with Mariaynes on Linkedin and Tableau Public.
DataFam Content
Blogs
- Luigi Cicciari: Why Rounded Corners in Tableau Matter More Than You Think
- Matt Huff: How to tell better data stories
- Ollie Linley: Do the Impossible with Dual Axis Charts
- Tarun Gupta: Visual Analytics: Understanding Data Through the Right Lens
- Matt Huff: Let's get social at conferences!
- Waqar Ahmed Shaikh:
- Johan de Groot:
- Deepak Holla:
Videos
- Gurpreet Singh: Tableau Field Dependencies Visualized in 10 Seconds using free app
- Louis Yu, Jacob Rothemund, Chris McClellan: Epi 109 : TUG Virtual Recordings Explorer
- Eric Parker: Replace Null Dates with Blanks in Tables
- Louis Yu and Matt Huff: Epi 110 : Playing with Food
- Waqar Ahmed Shaikh: Create Progress Pie Charts Inside a Text Table in Tableau
- Ollie Linley: Table Calculations vs LODs
- Fi Crocker, Sarah Burnett, Sarah Pallett, Celia Fryar, Sam Batchelor and Sudhaa Ramakrishnan: D35 Your Ultimate Guide to Tableau Conference 2026 - Tips to Take It to the Next Level
Social Posts and Other Content
- Adam Mico and Annabelle Rincon: DataFam Rising Stars 2026 Live!
- Deepak Holla:
Team Tableau Content
- Introducing the 2026 #TableauVisionary leaders
- DataDev AMA: Mastering Semantic Modeling with Tableau Visionary Adrian Zinovei and Tableau’s Kyle Massey
- Register for Tableau Conference 2026 to see customers and community experts share their stories
- Join the Tableau Conference 2026 Hackathon
- The new Tableau App for Microsoft 365 is now available
- Tableau March 2026 and Tableau 2026.1 releases are now available
- Download Tableau Desktop Free Edition
- Meet Your Iron Viz 2026 Lineup
Visualizations
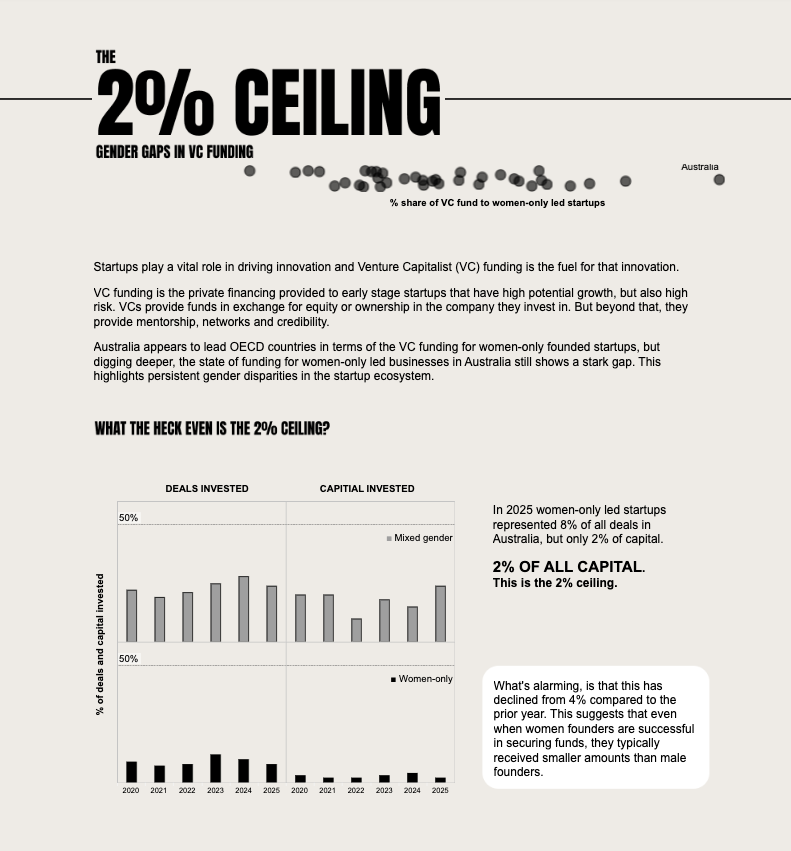
Kimly Scott: The 2% Ceiling | #WomensHistoryMonth
See the latest Viz of the Day, trending vizzes, featured authors, and more on Tableau Public.
Check out some inspirational vizzes created by the community:
- Aakarsh R: My Watchlist Since 2020
- Ann Stolzman: Who Wants Coffee?
- John Johansson: HR Attrition Dashboard
- Chie Sakaki: Still Life with Gyutan and Rice - created for #Tableauうまうま会 vol.24
- Matthias Giger: Tableau Resolve Issues Dashboard – back in automated mode
- Deepak Holla:
Community Projects
Back 2 Viz Basics
A bi-weekly project helping those who are newer in the community and just starting out with Tableau. Not limited just to newbies!
Web: Back 2 Viz Basics
X: #B2VB
Workout Wednesday
Build your skills with a weekly challenge to re-create an interactive data visualization.
Web: Workout Wednesday
X: #WOW2022
Preppin' Data
A weekly challenge to help you learn to prepare data and use Tableau Prep.
Web: Preppin’ Data
X: #PreppinData
Makeover Monday
Create business dashboards using provided data sets for various industries and departments.
Web: Makeover Monday
X: #MakeoverMonday
Data ChangeMakers
Volunteer to design data visualizations that help nonprofits harness the power of data for social change.
Web: Data ChangeMakers
Visual Climate
Collaborate and share climate data.
Web: Visual Climate
X: #VisualClimate
DataFam Con
A monthly challenge covering pop culture and fandoms.
Web: DataFam Con
X: #DataFamCon
EduVizzers
A monthly project connecting real education data with real people.
Web: Eduvizzers
Games Night Viz
A monthly project focusing on using data from your favorite games.
Web: Games Nights Viz
X: #GamesNightViz
Iron Quest
Practice data sourcing, preparation, and visualization skills in a themed monthly challenge.
Web: Iron Quest
X: #IronQuest
Storytelling with Data
Practice data visualization and storytelling skills by participating in monthly challenges and exercises.
Web: Storytelling with Data
X: #SWDChallenge
Project Health Viz
Uncover new stories by visualizing healthcare data sets provided each month.
Web: Project Health Viz
X: #ProjectHealthViz
Diversity in Data
An initiative centered around diversity, equity & awareness by visualizing provided datasets each month.
Web: Diversity in Data
X: #DiversityinData
Sports Viz Sunday
Create and share data visualizations using rich, sports-themed data sets in a monthly challenge.
Web: Sports Viz Sunday
X: #SportsVizSunday
Real World Fake Data
Create business dashboards using provided data sets for various industries and departments.
Web: Real World Fake Data
X: #RWFD
Data Plus Music
A monthly project visualizing the data behind the music we love!
Web: Data Plus Music
X: #DataPlusMusic
BizViz52
A weekly project centered around designing business dashboards.
Web: BizViz52
X: #BizViz52
Histórias relacionadas

DataFam Roundup June 2026

DataFam Roundup May 2026

Iron Viz 2026: Read Between the Data
 28 Maio, 2026