SIAM KUBOTA adds new dimensions to data analysis and unlocks opportunities in IoT
The speed and ease of analytics has enabled data to be applied to new use cases
Daily refresh of a COVID-19 visualization has saved up to four hours per day
Innovation in IoT has been accelerated with reduced barriers to analyzing data
SIAM KUBOTA Corporation is one of Thailand’s largest companies and specializes in manufacturing, sales, and leasing of construction and farming equipment. The company also has a research and development arm which is focused on driving advancements in agriculture and farm management. This includes helping farmers to monitor their crops using IoT and data visualizations.
Data has always been key to decision-making at SIAM KUBOTA Corporation and, with the introduction of Tableau, the company has elevated its data culture. Spreadsheets and presentations have been replaced with Tableau visualizations and data can be accessed in real-time by those who need it. Less than six months after going live with Tableau, SIAM KUBOTA Corporation has achieved significant time savings by automating dashboards and has added new dimensions to data analysis. New visualizations support the business to better forecast sales and manage risk and help to accelerate innovation in IoT.
Driving data transformation
With SIAM KUBOTA Corporation’s previous approach to analytics, it took hours of manual effort to model data and create visualizations that could be presented back to management. The company wanted to increase the ease and speed of analytics so that it could leverage its benefits more fully. Methee Srisupundit at SIAM KUBOTA Corporation was promoted into the role of Senior Information Technology Department Manager to lead this data transformation. Finding an analytics solution was the first step and he and his team chose Tableau because of its visualization capabilities and ease of use. The company started with Tableau Server but quickly moved to Tableau Cloud to take advantage of the scalable processing power and automatic upgrades. It also made it easier to provide access to new users.
“Rather than continually updating dashboards for the same use case, we can build one visualization that can be refreshed automatically,” said Srisupundit. “It means our stakeholders no longer need to wait for data. With Tableau Cloud, people can just log on and all the information they need is there and can be visualized all on one page.”
With Tableau Cloud, people can just log on and all the information they need is there and can be visualized all on one page.
The time that used to be spent building dashboards has been redirected to expanding the use of Tableau and showing people across the business how they can filter and analyze their own data. This has led to the quick adoption of Tableau and there are now around 200 employees involved in SIAM KUBOTA Corporation’s Tableau ecosystem, including 80 who have a role in creating visualizations. The company is focused on training and empowering more and is using Tableau for a number of internal-use cases including sales forecasting, monitoring manufacturing lines, customer segmentation analysis, and making predictions about customer repurchase behavior.
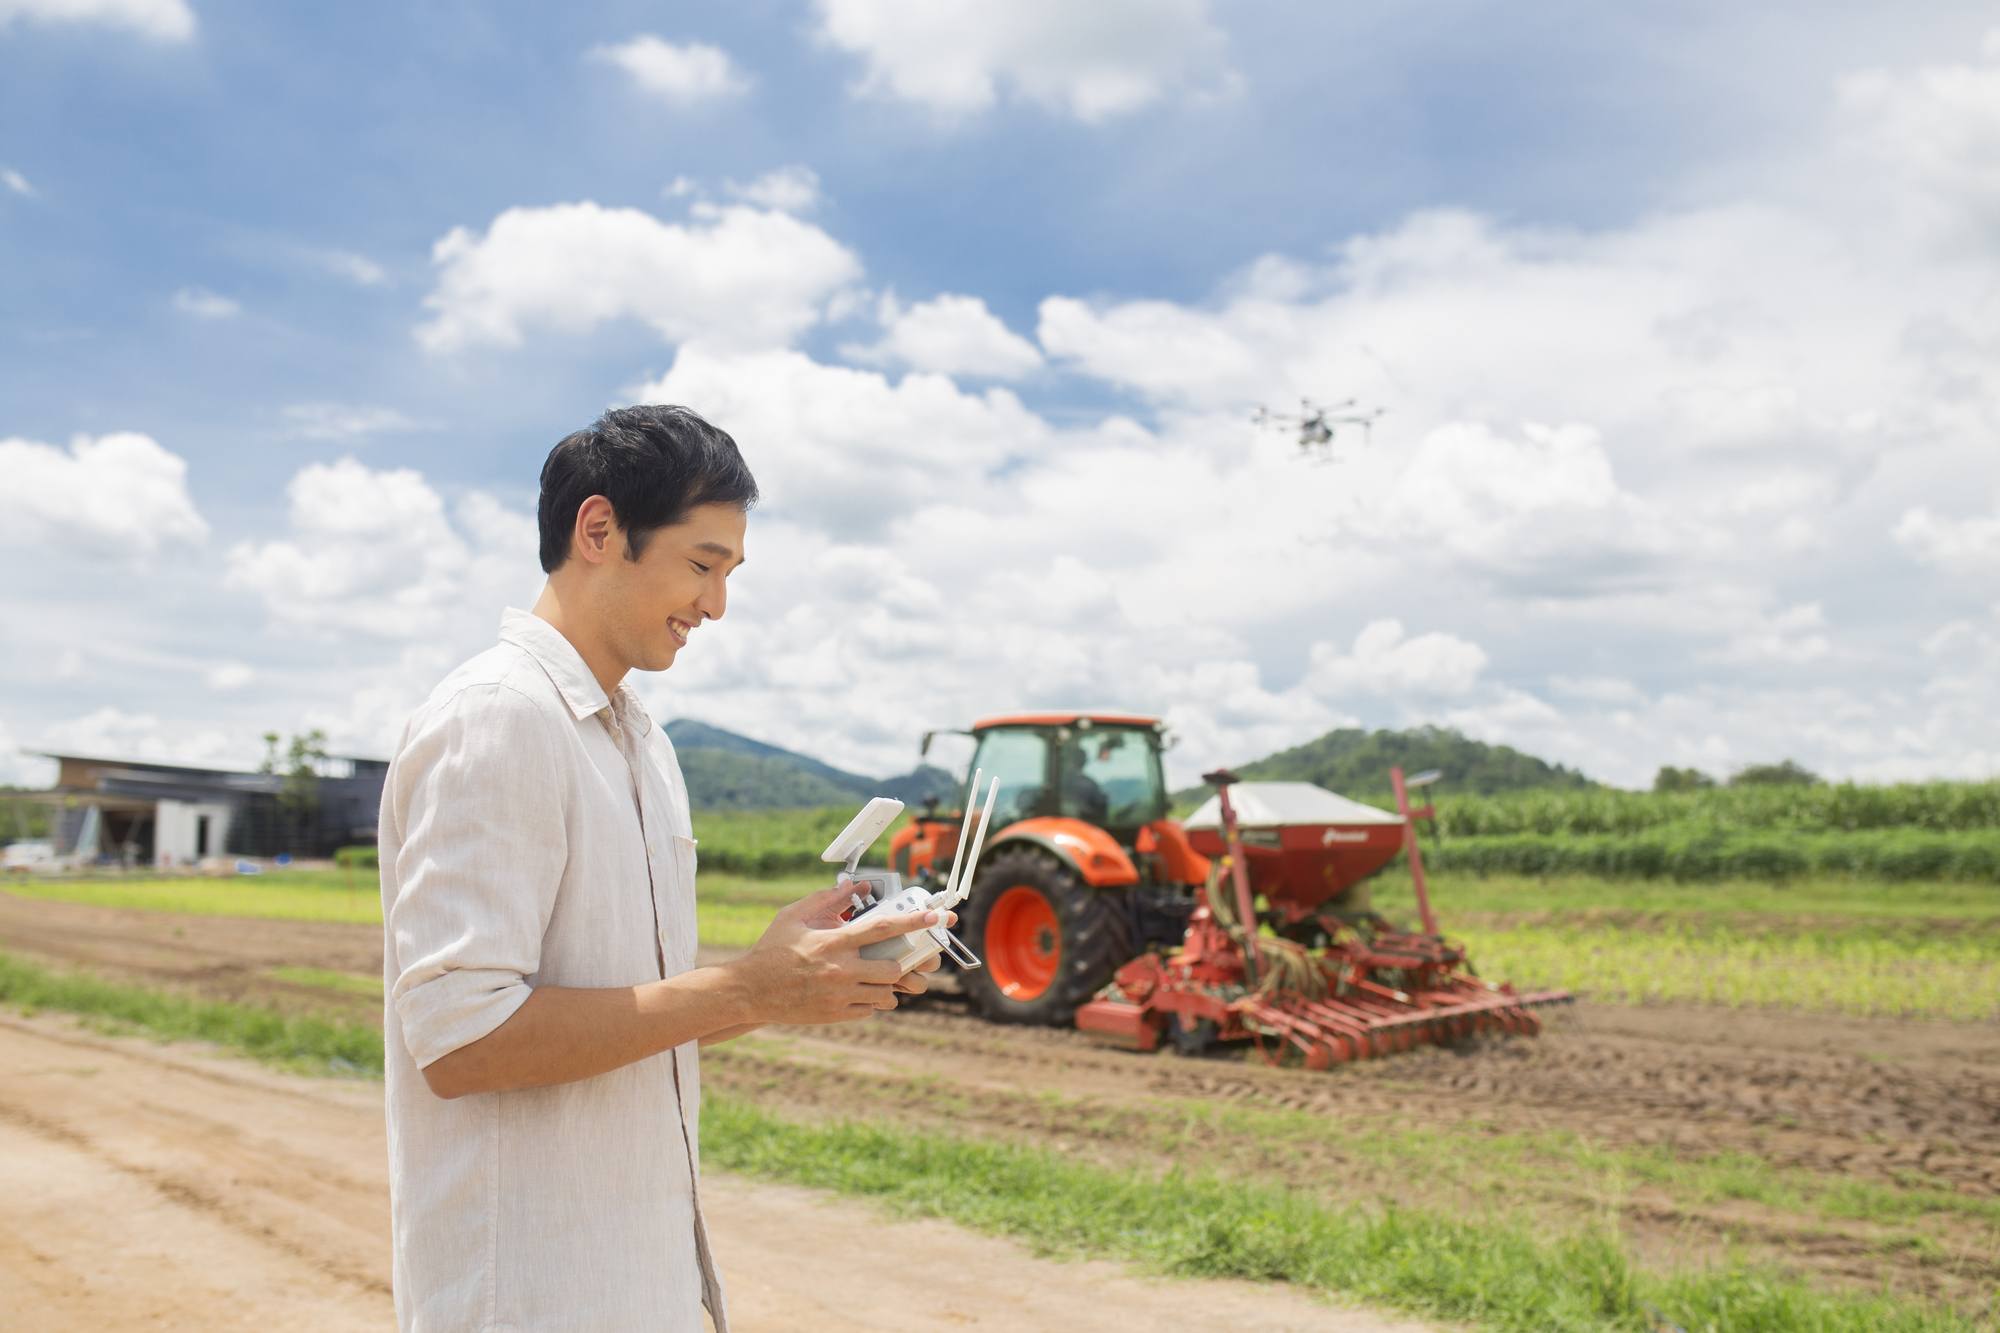
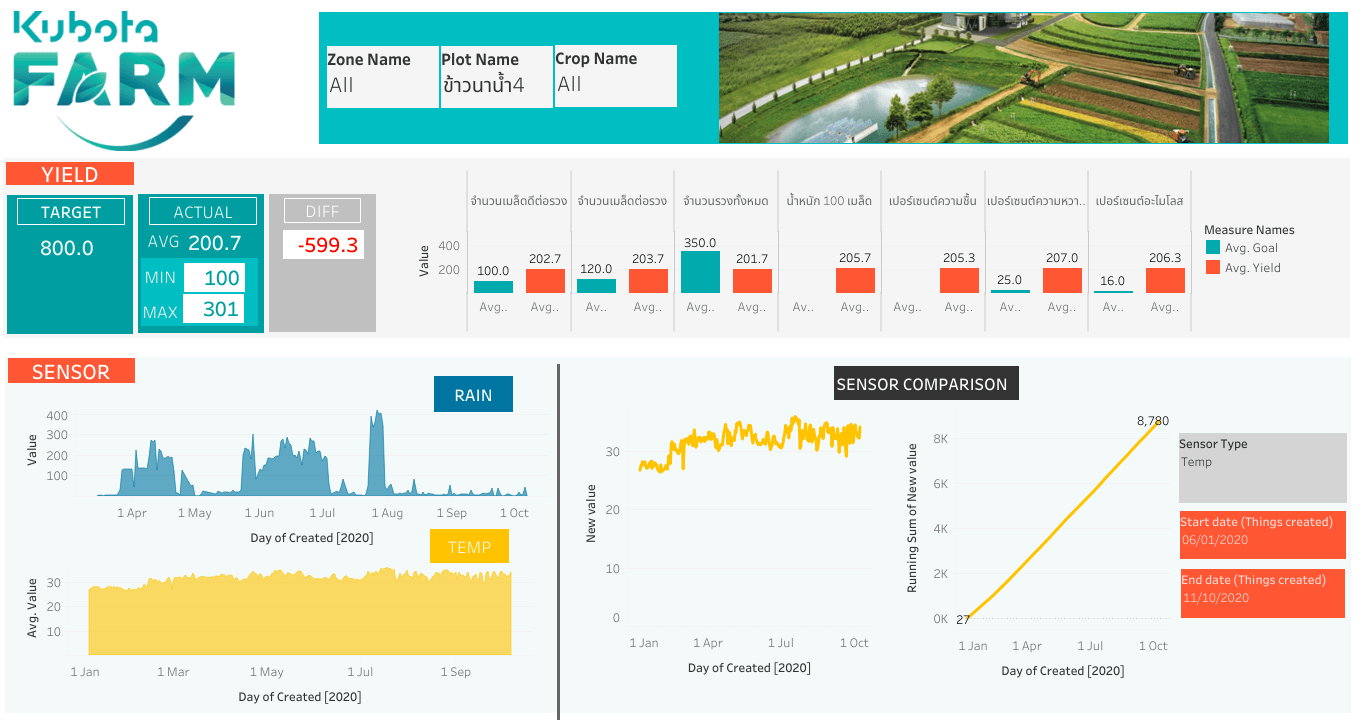
SIAM KUBOTA Corporation is also using Tableau to visualize data collected from IoT devices in the fields of its farming customers. When the company first began helping farmers leverage IoT, it relied on a programmer to create and edit visualizations. Now, that programmer has been freed up to focus on data collection and visualizations can be created and shared with customers much faster.
Saving a half-day, every day on data analytics
SIAM KUBOTA Corporation went live with Tableau in April 2020 and one of the first visualizations created was used to monitor the impact of COVID-19 on employees. The company has 3,000 employees and wanted to know on a daily basis whether they were healthy or had any symptoms. A Google Form was set up with a short questionnaire for employees to complete daily and the results were initially compiled manually. Now, the data flows straight from Google into Tableau instead and the visualization is refreshed automatically. This has saved the company a half-day, every day on analysis.
The COVID-19 dashboard also helped the management team to understand the value of Tableau, and Srisupundit and his team are now responding to requests for additional visualizations. “The next step for us is to drive the use of data even deeper into our culture so that it starts to grow organically. This will help us to look at the business through different dimensions and give us more insights to serve our customers.”