PepsiCo cuts analysis time by up to 90% with Tableau + Trifacta
Up to 90% reduction in report production time
Wrangle big data for analytics at scale
“Best-in-class-service” with faster customer analysis
Consumers enjoy PepsiCo products one billion times a day in more than 200 countries and territories around the world. To make sense of data from retail customers, PepsiCo adopted Tableau and reduced report production time by as much as 90%. Using Trifacta, the CPFR team wrangled disparate data, pulling it into Tableau for forecasting and analysis—reducing end-to-end run time of PepsiCo’s analysis by as much as 70% and report production time by as much as 90%. With faster, accurate reporting, PepsiCo has a competitive advantage in the retail space and provides best-in-class service to customers.
Now we’re not taking our time putting the data together; we’re spending our time analyzing the data, telling the story, and finding problems.
Searching for a single source of truth
PepsiCo’s customers provide them with reports that include warehouse inventory, store inventory, and point-of-sale inventory. PepsiCo reconciles this data with their own shipment history, production numbers, and forecast data. Each customer had their own data standards, which didn't correspond with each other (let alone PepsiCo's system). For example, PepsiCo relied on UPC codes to identify each product, while customers created their own internal numbers.
Wrangling this data was a challenge and reports could take months to generate. Analysts knew that their ability to quickly standardize data across all retailers—and speak the same language as their customers—was critical to preparing data faster for their forecasting and planning efforts.
Churning out sales forecasts fast enough for management to steer the course on sales was another challenge. Each new report required the CPFR team’s analysts to build a tool in Microsoft Access that combined retailers’ sales data and PepsiCo supply data; a process that could take up to six months.
The team primarily relied on Excel for analysis, creating large quantities of messy data. And the team had no efficient way to spot errors, leading to potentially costly outcomes. For example, a missing product from a report could result in inaccurate forecasts and lost revenue.
The CPFR team needed a way to wrangle large quantities of disparate data. At the same time, the team needed a visual analysis tool that could help them make the most of PepsiCo data.
Finding the right solution for better data
To bring coherence to the data, PepsiCo turned to Tableau partner, Trifacta.
For greater efficiency and scale, PepsiCo implemented Hortonworks Hadoop as a landing and staging environment for this variety of data. Now reports run directly on Hadoop, without involving multiple steps with Access and PepsiCo servers. This process allows analysts to directly manipulate data using Trifacta.
Tableau provides PepsiCo with the finishing step: powerful analytics and visualizations, helping the business make sense of volumes of data. PepsiCo analysts share relevant Tableau workbooks with management over Tableau Server.
We’re able to turn customer data around and present it to the rest of our company, in a way that everyone can understand, faster than our competitors.
Powerful results with Trifacta + Tableau
The combined use of Tableau and Trifacta helps the CPFR team drive the business forward, increasing visibility into customer orders. Trifacta’s visual profiling capabilities and Tableau’s advanced visual analytics allow the team to easily identify gaps and get ahead of larger issues.
Trifacta integrates natively with Tableau Data Extracts (TDE), allowing PepsiCo analysts to seamlessly transition between the two technologies. PepsiCo brings Tableau data extracts into Tableau Desktop, allowing them to maintain performance on big data.
The combination of Trifacta’s data wrangling power and Tableau’s analytical depth allows PepsiCo to streamline its process. This has dramatically reduced time spent on data preparation and increased the overall quality of the data. Normalized data in Trifacta helps catch errors and flaws in the data. And with Tableau, PepsiCo can easily spot outliers and take action. If issues arise, they can correct mistakes before causing any bigger problems downstream.
Performing data analysis with Tableau using Trifacta's normalized data has reduced the end-to-end run time of PepsiCo's analysis by as much as 70%. The ability to reproduce patterns makes building CPFR tools a more efficient, automated process.
PepsiCo now spends less time preparing data, and more time finding insights. Mike Riegling, Supply Chain Data Analyst at PepsiCo, said, “Now we’re not taking our time putting the data together; we’re spending our time analyzing the data, telling the story, and finding problems.”
Building these reports in Tableau reduces production time by as much as 90%, and visualizations that used to take up to six months to build are now ready within a day.

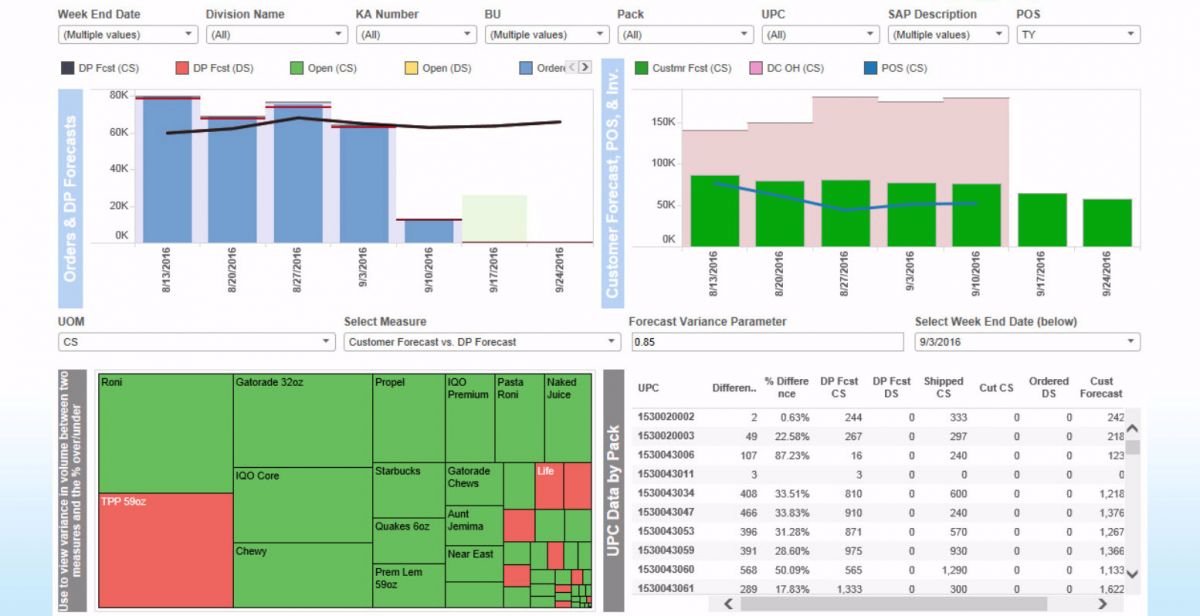
A sample CPFR dashboard from PepsiCo.
In Tableau Desktop, PepsiCo analyzes inventory, logistical, and finance data from across the country. Bringing the data into Tableau Desktop allows PepsiCo to make sense of big data and empowers analysts to create supply chain and forecasting reports in record time.
Analysts refine the data to answer questions, spot trends, and plan for future demand—saving the company money. The IT department publishes TDEs to Tableau Server, encouraging collaboration between teams—and enabling self-service analytics at scale.
Gaining insight from customer data faster than ever has enhanced PepsiCo’s process to offer its customers best-in-class service. It has also given PepsiCo a huge competitive advantage over other CPG businesses.
PepsiCo can now predict trends, adjust sales, and ultimately sell more of the right product to improve their bottom line. Riegling commented, “We’re able to turn customer data around and present it to the rest of our company, in a way that everyone can understand, faster than our competitors.”