DataFam Roundup: June 14 - June 18, 2021


Dig into the latest DataFam Roundup—a weekly blog that brings together community content all in one post. As always, we invite you to send us your content—and the DataFam content from your peers that have inspired you! Find the content submission form here.
Celebrating Pride Month
Pride Month is a celebration of the impact that the LGBTQ+ community has had on making this world a better place. We are thrilled to be launching a new Pride exhibition in the Tableau Public Viz Gallery during the month of June - we hope you’ll take the time to explore the gallery and walk away feeling like you learned something new. Check out all the featured authors in this exhibit here.
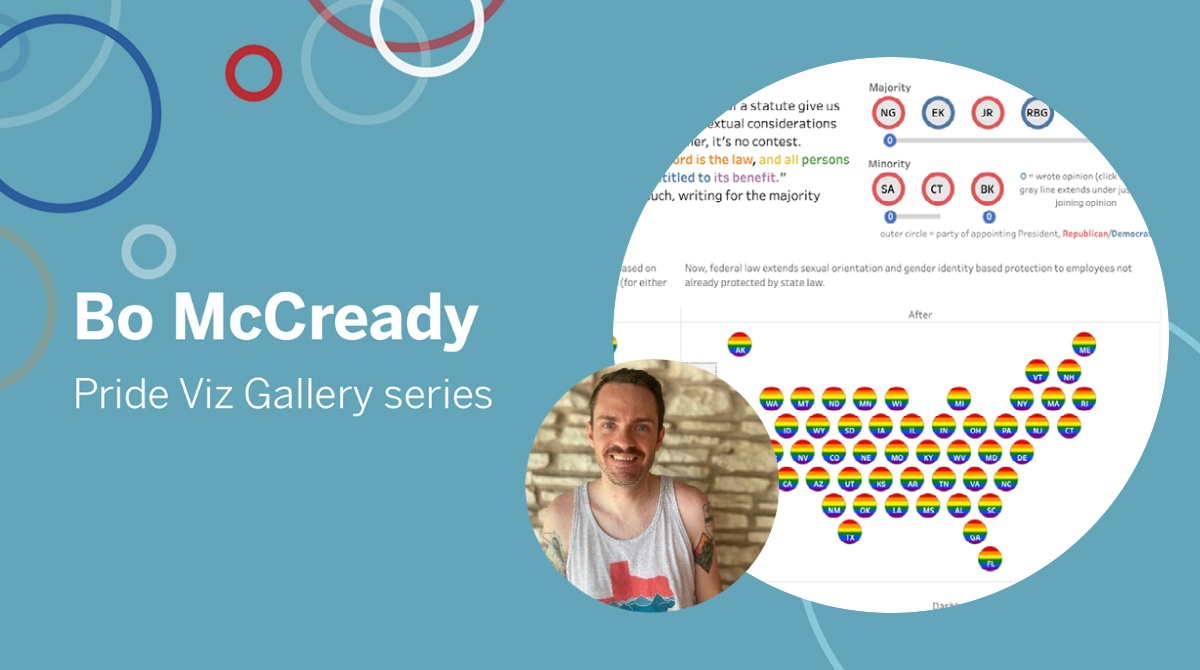
Learn more about Bo McCready, his visualization ‘The Answer is Clear: Title VII and LGBTQ+ Employees’ and his experiences with the Tableau Community in this featured blog post.
DataFam content
How to embed transparent Tableau visualizations into portals and apps. Should I do it? Alex Eskinasy
Dive into content created by the Tableau Community:
- How to Create a Dot Strip Plot Andy Kriebel
- Flow Chart Template Toan Hoang
- 태블로 맵 드릴다운 만들기 (Feat. 맵 박스 활용) (Korean)
- Return to Where You Came From: How to drill down to one report from two places and get back the source dashboard Lindsay Betzendahl
- Pan American Health Organization on the COVID-19 Story Dan Murray with Patricia Schroeder Mariduena and Jisoo Kim from the Pan American Health Organization
- Linear vs. Quadratic Scaling: How it Distorts Infographic Bar Charts, And How to Get It Right Robert Kosara
- Organising Hybrid Events Alexander Waleczek
- Migrating from Tableau Server to Tableau Online Sara Seylani
- 3 Innovative Ways to Use Filters in Tableau | Playfair Data Maggy Muellner
- Alice Boone McKnight on Blazing a New Career Path with Data Allen Hillery
- Tableau Community Forums June Survey
Upcoming events
Check out all the virtual Tableau User Group events here and catch up on this past week's Tableau User Group Weekly: June 14 - June 18, 2021—a weekly blog series highlighting the latest Tableau User Group events around the world.
June 23, 12 pm PT - June 25, 12 pm PT Tableau Community Braindates: Learn and connect with the DataFam on all things Tableau and community. Register here.
June 21 - 25 Iron Viz Feedback 10 Tableau Community members have teamed up to provide support for participants entering into the Iron Viz qualifer contest. Read more about it here and sign up for a 15 minute meeting slot here.
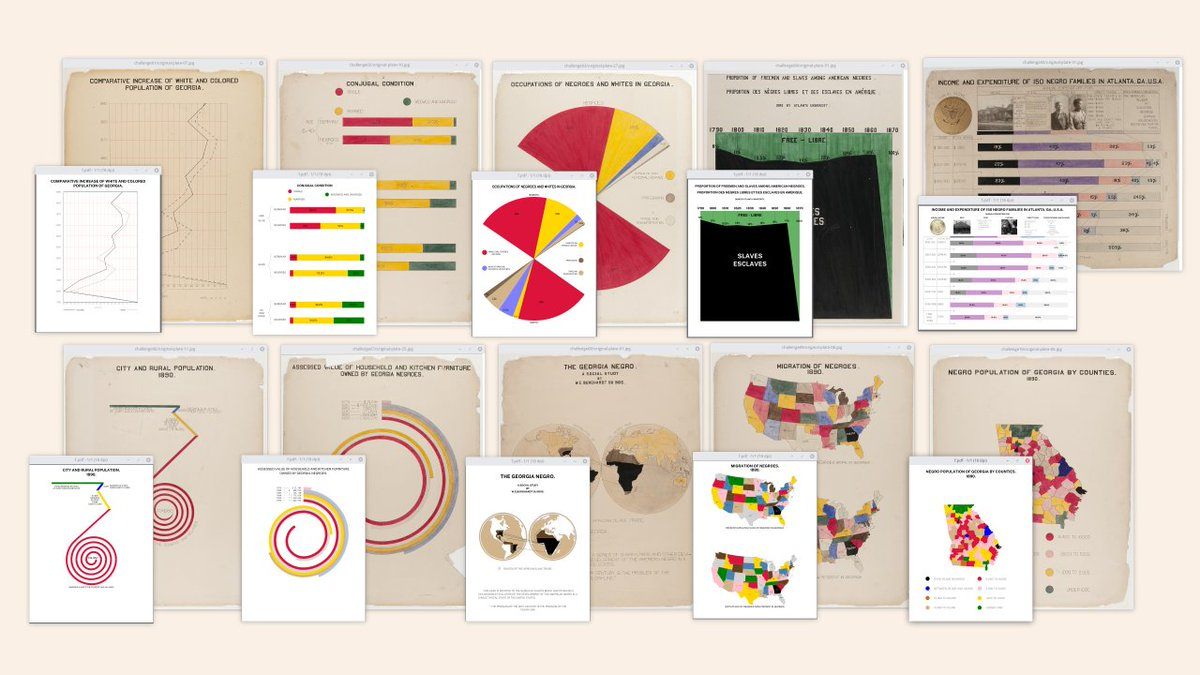
Behind the #DuBoisChallenge
Allen Hillery, a Tableau Social Ambassador, Sekou Tyler, Director of Training and Data Visualization at Lovelytics, and Anthony J. Starks, an independent consultant, speak about W.E.B. Du Bois’s life and a challenge to recreate his data visualizations. They speak on a webinar provided by the W.E.B. Du Bois Center at UMass Amherst. Watch now.
Vizzes
Catch this week’s Viz of the Days here and subscribe to get them emailed directly to your inbox.
Check out some inspirational vizzes created by the community:
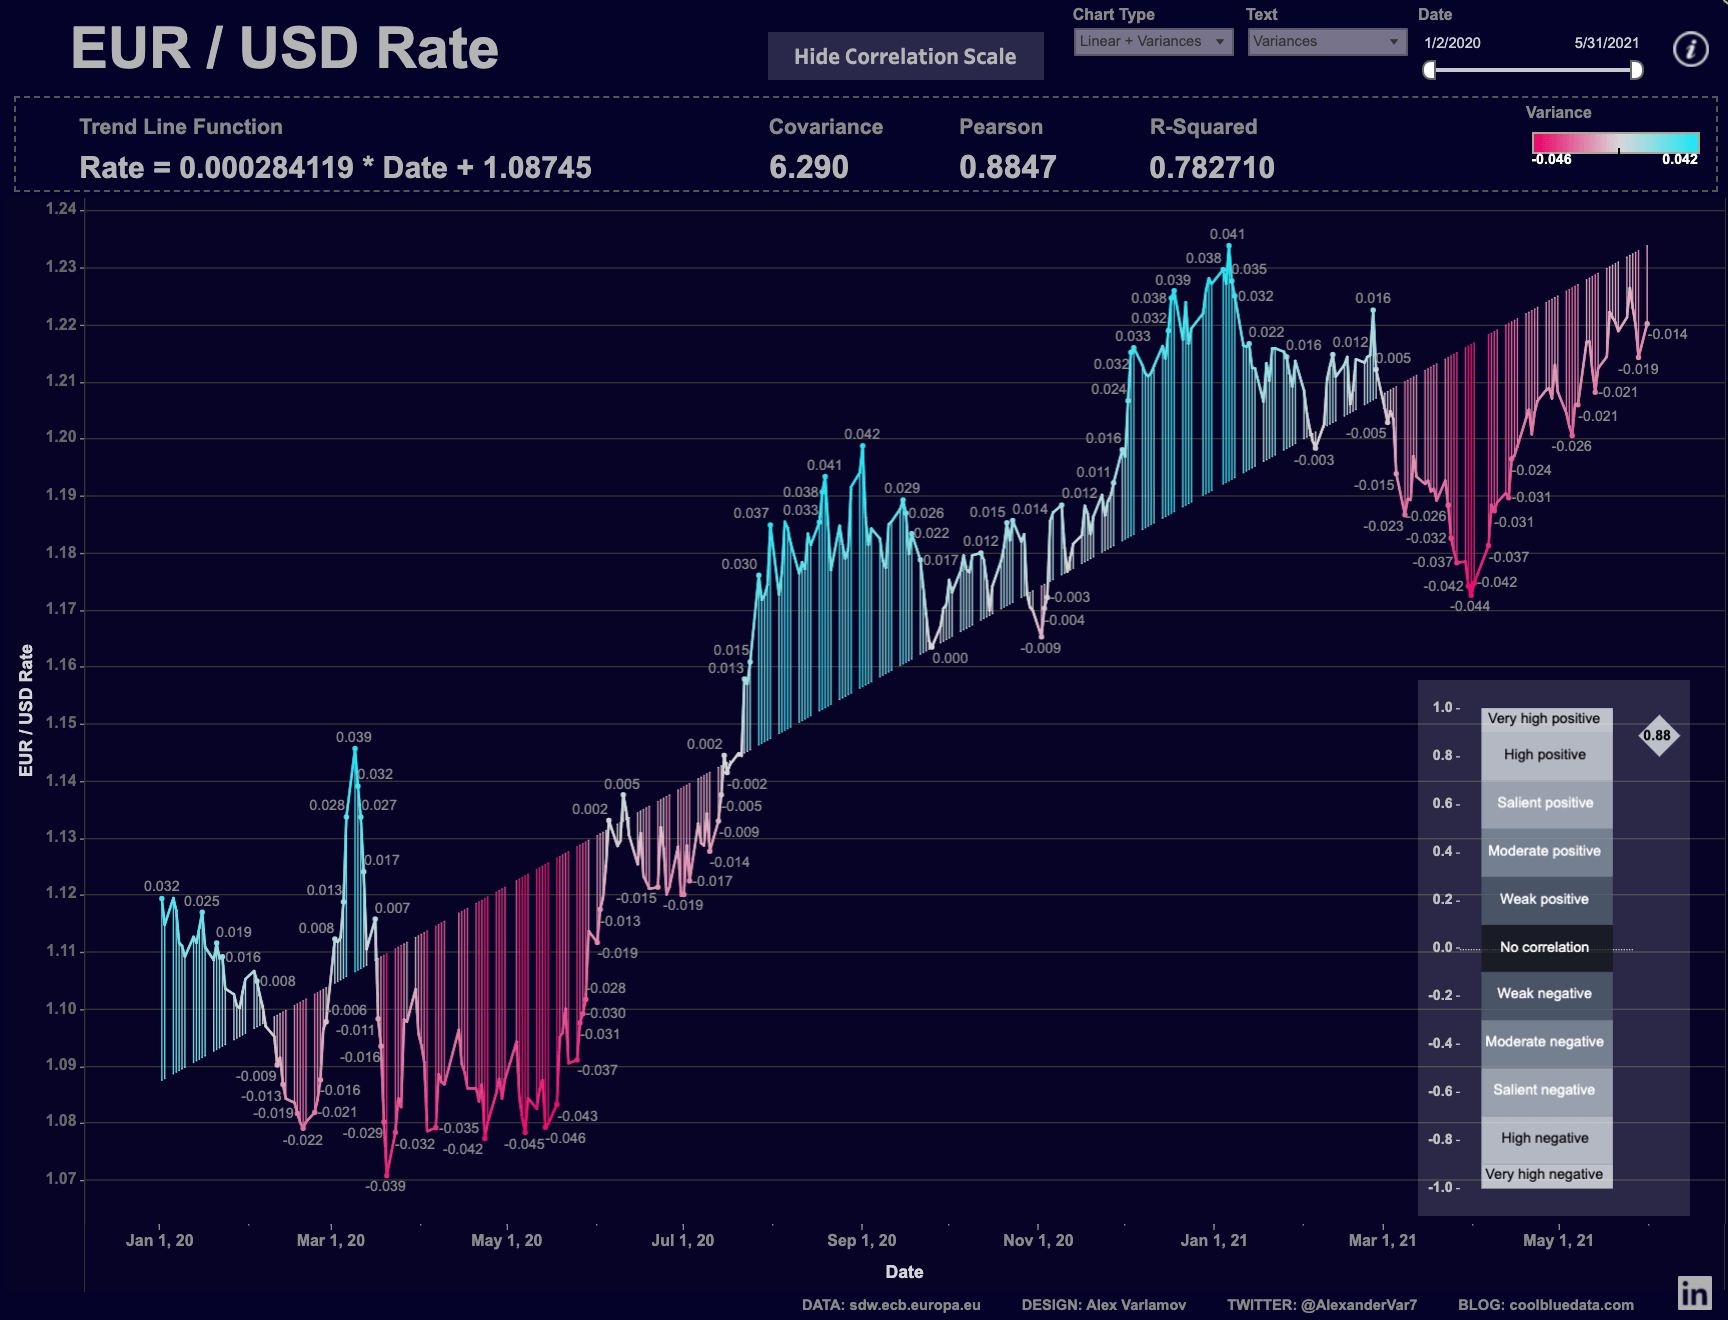
- Linear regression Alex Varlamov
- Know Your Poke Irene Saravia
-
TaeKwonDo - My Lockdown Training Ant Pulley
-
Demo Wealth and Banking - Manager View Ellen Blackburn

Makeover Monday
Join the community every Monday to work with a given data set and create better, more effective visualizations.
Web: Makeover Monday
Twitter: #MakeoverMonday
Week 24: What Schools Create the Most Student Loans in the U.S.?
Workout Wednesday
Build your skills with a weekly challenge to re-create an interactive data visualization.
Web: Workout Wednesday
Twitter: #WOW2021
Week 24: Can you visualise the Cholera Outbreak?
Sports Viz Sunday
Create and share data visualizations using rich, sports-themed data sets in a monthly challenge.
Web: Sports Viz Sunday
Twitter: #SportsVizSunday
June 2021: Football European Championships
Iron Quest
Practice data sourcing, preparation, and visualization skills in a themed monthly challenge.
Web: Iron Quest
Twitter: #IronQuest
Storytelling with Data
Practice data visualization and storytelling skills by participating in monthly challenges and exercises.
Web: Storytelling with Data
Twitter: #SWDChallenge
June 2021 2021: reading into red
Project Health Viz
Uncover new stories by visualizing healthcare data sets provided each month.
Web: Project Health Viz
Twitter: #ProjectHealthViz
May 2021: Registered Nursing Labor Stats (1998-2020)
SDG Viz Project
Visualize data about Sustainable Development Goals provided by the World Health Organization.
Web: SDG Viz Project
Twitter: #TheSDGVizProject
Goal 16: Peace, Justice, and Strong Institutions
Preppin' Data
A weekly challenge to help you learn to prepare data and use Tableau Prep.
Web: Preppin’ Data
Twitter: #PreppinData
Week 24: C&BS Co Absence Monitoring
Real World Fake Data
Create business dashboards using provided data sets for various industries and departments.
Web: Real World Fake Data
Twitter: #RWFD
Dataset #11: Hospitality
Viz 2 Educate
Each month, create vizzes on global education syllabus topics as resources for teachers worldwide.
Web: Viz 2 Educate
Twitter: #Viz2educate
Diversity in Data
An initiative centered around diversity, equity & awareness by visualizing provided datasets each month.
Web: Diversity in Data
Twitter: #DiversityinData
June 2021: Pride Month
Viz for Social Good
Volunteer to design data visualizations that help nonprofits harness the power of data for social change.
Web: Viz for Social Good
Twitter: #VizforSocialGood
Verwante verhalen
DataFam Roundup July 2026

DataFam Roundup June 2026
