Alle verhalen
 Tableau Community
TC18 customer speaker applications are open!
 14 maart, 2018
If you’ve dreamed of sharing your Tableau story with thousands of like-minded data enthusiasts, please consider applying to be a customer speaker.
14 maart, 2018
If you’ve dreamed of sharing your Tableau story with thousands of like-minded data enthusiasts, please consider applying to be a customer speaker. Tableau Community
Tableau takes on the Makeover Monday Live challenge!
 13 maart, 2018
Hundreds of different people participate and share their creation on Twitter with the hashtag #MakeoverMonday. This week, the employees at Tableau joined in for some live action fun as well.
13 maart, 2018
Hundreds of different people participate and share their creation on Twitter with the hashtag #MakeoverMonday. This week, the employees at Tableau joined in for some live action fun as well. Enterprise
Gartner BI Bake Off: Using Tableau to understand the opioid crisis
 9 maart, 2018
Each year, Gartner invites the leader to take part in their BI Bake Off, where each vendor does scripted demoes to highlight their products. This year, Andy Cotgreave presented our behalf. He highlighted Tableau’s capabilities in five categories, which included Dashboarding, Data Preparation, and Governance.
9 maart, 2018
Each year, Gartner invites the leader to take part in their BI Bake Off, where each vendor does scripted demoes to highlight their products. This year, Andy Cotgreave presented our behalf. He highlighted Tableau’s capabilities in five categories, which included Dashboarding, Data Preparation, and Governance.
 Tableau Community
Female voices—past and present—emerge as powerful leaders in data
8 maart, 2018To celebrate International Women’s Day and honor women who have charted the path for others in data, Tableau asks our community who you think is the next generation of women leaders that will shape our future.
 Data
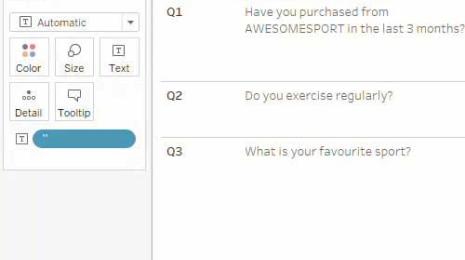
DataPrepare survey data for analysis with three easy steps
 7 maart, 2018
In this blog post, I’ll walk you through some steps on how to reshape survey data for easier analysis in Tableau.
7 maart, 2018
In this blog post, I’ll walk you through some steps on how to reshape survey data for easier analysis in Tableau.
 Product
Make your regular lines step and jump!
 5 maart, 2018
Step and jump Lines are now available in Beta and will officially become available in Tableau 2018.1!
5 maart, 2018
Step and jump Lines are now available in Beta and will officially become available in Tableau 2018.1!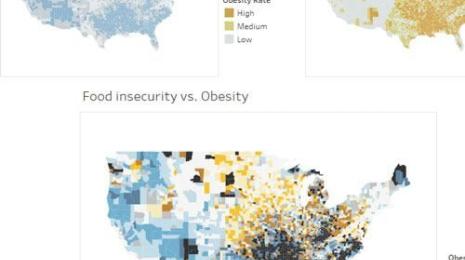 Visualizations
How to make effective bivariate choropleth maps with Tableau
 1 maart, 2018
Maps are a great type of viz for exploring how your data changes across space. In Tableau, it’s easy to make a map to explore any attribute in your dataset—but what about the occasion where you want to compare multiple attributes with the visualization?
 Data
DataHow a data-driven government can enhance its mission
 26 februari, 2018
Learn more about implementing an analytics platform for data-driven, mission-led government.
26 februari, 2018
Learn more about implementing an analytics platform for data-driven, mission-led government.