Mapping Month Is Back!


Ever since Tableau 4.0 introduced maps, they’ve been a vital part of viz-making. In fact, thirty of the last fifty vizzes that won Viz of the Day have included a map. That’s sixty percent of the most recent Viz of the Day winners! That’s why for the month of January, we are bringing back the always-popular Mapping Month!
There’s just something hypnotic about maps.
We couldn’t agree with Mr. Jennings more. For Mapping Month in 2014, the Tableau Public team visited Metsker Maps here in Seattle and picked up a couple for the office:
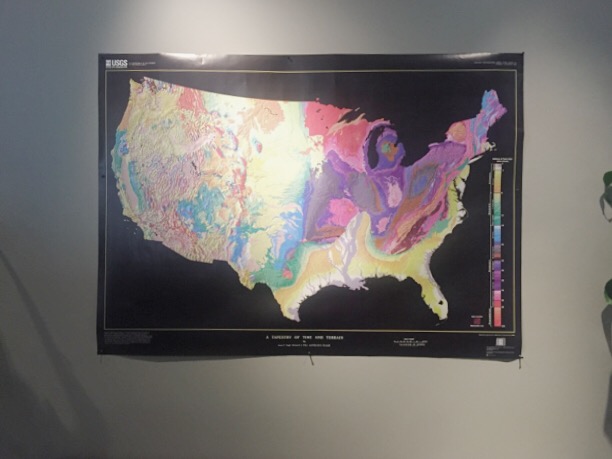
This one is titled “A Tapestry of Time and Terrain” and is made by the USGS.
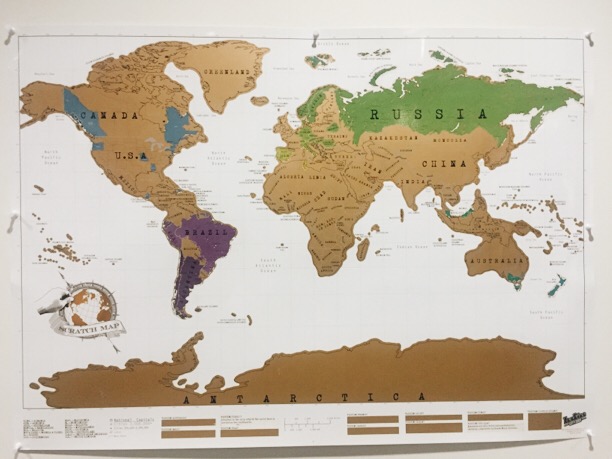
This map allows you to scratch off places to reveal the colors below. Our team scratches off a country or a state whenever a publisher from that place makes our list of top-ten views for the week.
I personally am also a little crazy for maps. My whole living room is map themed with lots of maps on throw pillows, coasters, and even a whole wall covered in a map tapestry:

This gif is of me in my living room, demonstrating ”Watch Me Viz," the dance craze that swept through Tableau nation.
Over the next month, we will be continuing the map lovefest with posts about mapping in Tableau. Join in on the conversation by tweeting us @tableaupublic or using the hashtag #MappingMonth. And if you can’t wait for all the maptastic content to roll in, check out the posts from our last Mapping Month. Happy mapping!
관련 스토리

Iron Viz 2026: Read Between the Data
 2026/05/28

Tableau's Iron Viz Winners

Explore the 2026 Iron Viz Entries
 2025/12/15