Introducing support for custom R and Python scripts in Tableau Prep flows


Update: The latest version of Tableau is here! Explore the newest innovations in this release.
Tableau Prep Builder is a powerful tool to explore and prepare data. The complexity of the flows that people create varies greatly. While Prep Builder can handle many use cases in a breeze, there are still advanced scenarios which can’t be easily configured.
To address this gap and enable even more fascinating ways to interact with Tableau Prep, we’re adding support for custom Python and R script execution from within Tableau Prep flows. This feature is currently in beta for our upcoming Tableau 2019.3 release.
Users can connect their scripts at any step in the flow and unleash the full power of their favorite scripting language to transform the data, look up additional information in remote sources, or even run complex machine learning pipelines on top of the inputs.
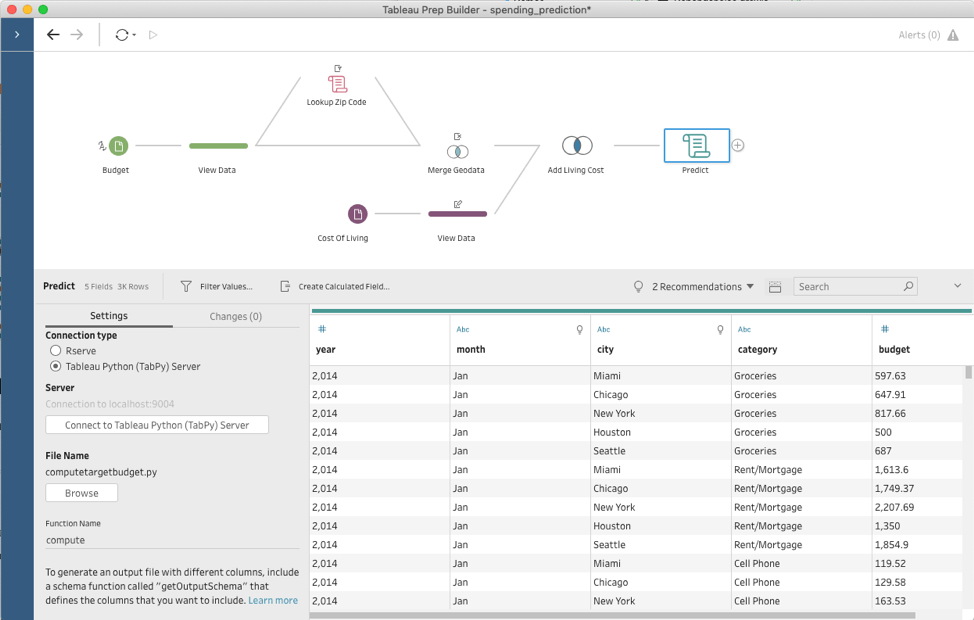
Add a custom R or Python script at any step in your Tableau Prep flows.
In the example in this post, I explain how to configure Prep Builder to run Python scripts and show some of the cool ways to take advantage of this new capability—like performing geographic lookups.
All kinds of custom scripts can be used to explore “what-if” scenarios, but my goal here is to compare the spending and cost of living data in different locations in the US together to predict how my budget might look like if I were to move to some other city. The flow I’m creating relies on budgeting data that I gathered over the last couple of years, cost of living data, and matching zip codes to cities.
Setting up TabPy
Tableau Prep Builder uses TabPy—an open-source tool—to execute Python code. Since script execution is an advanced feature and user setups very greatly, Prep Builder doesn’t include TabPy out of the box. But fear not! The setup is extremely easy—get started here. If everything is configured as expected, there will be a port number at the very bottom for connecting to TabPy server. The value is “9004” by default.
As with any other language, Python heavily relies on third party libraries to make itself more useful. Prep requires that the "pandas" library is installed, as it provides an efficient data frame which we use to pass data to and from Python. The installation is extremely easy and relies on the tool “pip,” which is shipped together with Python. For my budgeting problem I also need a library, “requests,” so I will install both by running
> pip install pandas requests
and restarting TabPy server. If at any point you need additional libraries for Python, just install them using “pip” and restart TabPy.
At this point, everything is configured, and I can focus on solving my problem.
Running a geographic lookup
In order to predict my expenses in different cities, I am relying on the cost of living index. The index is a relative expensiveness of a city, expressed in percentage compared to New York City, which has a value of 100. Since my raw budget data has zip codes, not cities, I need a way to convert them. I’ll take advantage of the Python integration to programmatically look up the city that each zip code belongs to.
This process is as simple as adding a script step, pointing it to a Python script file, and providing a function name to call inside that file. Prep Builder sends all input data from the previous step to TabPy and calls this function with the data as an argument. Prep Builder then shows you the returned data set in the script step.
Let’s unpack all of that with my specific example of the zip code conversion. Here is the script file:
 import requests

 API_KEY = ""
 URL = f'https://www.zipcodeapi.com/rest/{API_KEY}/info.json'

 def lookup(df):
 	result = pd.DataFrame(columns=['zip_code','city', 'state','area'])
 	for zip in df['zip_code'].unique():
 		response = requests.get(f'{URL}/{zip}/radians').json()
 		zip_code = response['zip_code']
 		city = response['city']
 		state = response['state']
 		result = result.append({
 				'zip_code' : zip_code,
 				'current city' : city,
 				'state' : state
 			}, ignore_index=True)
 	return result

 def get_output_schema():
 	return pd.DataFrame({
 			'zip_code' : prep_string(),
 			'current city' : prep_string(),
 			'state' : prep_string()
 		});
The script file defines two functions: “lookup” and “get_output_schema.”
The “lookup” function is the heart of the execution and does the actual data transformation. This is the function we configure in Prep Builder’s UI. It takes an input as the “pandas” data set and uses the “zip_code” column to request the corresponding city and state from zipcodeapi.com. The result is yet another “pandas” data set with three columns: the original zip code, current city, and state. Note that we don’t touch any other columns in the input—as long as it contains the “zip_code” column, the script will work just fine, regardless of the rest of the data there.
The second function, “get_output_schema,” lets Prep Builder understand the data to expect as the outcome from the script. If you look at the script carefully, you’ll notice that it returns a “pandas” data frame with the same exact columns as the "lookup" function, but has values like “prep_string()” to tell Prep Builder the data type to expect. There are, of course, other supported types like “prep_int()” or “prep_bool().”
One more thing before we move on: The first time you add a script step to a flow, you must also tell Prep Builder how to connect to TabPy. This is done by selecting the “Tableau Python (TabPy) Server” connection type and clicking on “Connect to Tableau Python (TabPy) Server.” In the popup window, you need to tell Prep Builder the server name and port number for the TabPy instance. For a local setup like the one I described above, the values are “localhost” for the server, and “9004” for the port number.
Preparing the data set for predictive modeling
With the script from the last section it's extremely easy to supplement my budget data with the correct city and state. Joining the response from the script back with the original input merges the data together and facilitates further processing.
Before I can predict my expenses, however, I need to add cost of living data. There are similar APIs to fetch such information, but it is not freely available, so instead I decided to use a fixed csv file with the data I need. Of course, if you have access to APIs that allow you to fetch this kind of information, I encourage you to use that instead—like the zip code lookup.
The data I have includes just the city name, corresponding cost of living index, and the year it was captured. I’ve gathered data for five cities from 2014 to 2019, which should be a good enough sample for kind of question I have.
Since I am trying to predict budgets in multiple cities based on the data from a specific place and point in time, it naturally corresponds to a one-to-many relationship. Every record in my budget data set corresponds to every “target” city and its index for the same year when each budget entry was created. This can easily be expressed as an inner join in Prep Builder.
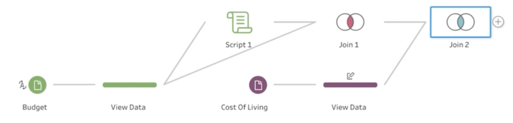
The flow pane provides a visual representation of the data prep steps.
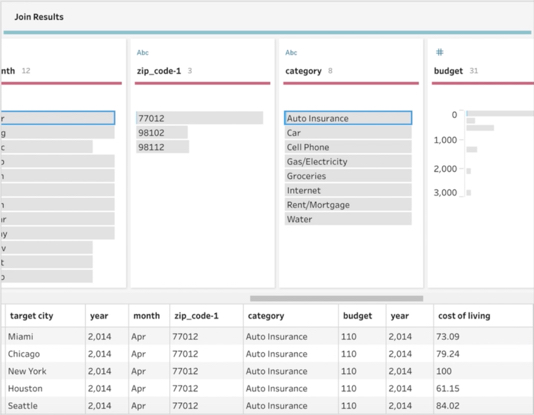
The profile pane and data grid display the results of the inner join.
Predicting my expenses
Now that I have all the data merged together, I can finally work on predicting my potential expenses. The exact logic on how to do that can vary greatly—from a simple calculation to a sophisticated machine learning model that analyzes my budget data and infers subtle differences in spending patterns over time. In any case, Python can greatly help with the task. Not only does it allow for complex data transformations, but it has awesome libraries for building complex machine learning pipelines. I can easily create another script and feed my full data set into it to predict my expenses. And even though this task and script are quite different, the process to set all of it up in Prep Builder is identical to what I did with the zip codes lookup.
I can then create an output data source and publish the results of my predictions to Tableau Server. Even more impressive is that I can easily schedule the resulting flow as a Prep Conductor job to refresh my machine learning pipeline as regularly as I want!
A point of clarification: While you can publish results to Tableau Online, executing flows containing scripts with Tableau Prep Conductor is not yet supported in Tableau Online.
Conclusion
With this new scripting support in Prep Builder, it’s now easier than ever to implement complex data transformation scenarios which go well beyond built-in capabilities of the product. It covers everything from simple calculations to complex machine learning models and fetching data from the internet.
While in beta, we’ve received extremely positive feedback from our community. There is clearly a huge demand for custom scripting support, as people with all kinds of backgrounds hack their own snippets to make Prep Builder even more powerful. I’m so excited about this integration and hope that I was able to show you how simple it is to start writing your own Python scripts and integrate them with Tableau Prep.
To test out your own ideas and see Python and R integrations in action in our 2019.3 beta, join our pre-release program today.
관련 스토리

Extend Access to Embedded Tableau Content with On-Demand Access
 2026/07/22

The Tableau+ Bundle with Premium AI, Enterprise Capabilities, and Premier Success
 2026/06/24

What is Tableau Prep?
 2026/04/30