DataFam Roundup: March 20-24, 2023


Welcome! Dig into this week's DataFam Roundup—a weekly blog that brings together community content all in one post. As always, we invite you to send us your content—and the DataFam content from your peers that have inspired you! Find the content submission form here.
Community Highlight
To recognize new and consistent Tableau contributors—we’re excited to have a section within the weekly DataFam Roundup called the Tableau Community Highlight. Find out how to get involved.

Viviane Lefebvre, Data Scientist Consultant at Batt Advisors
Nancy, France
Viviane Lefebvre is a Data Scientist Consultant at Batt Advisors. She began her Tableau journey as the Tableau expert at work but has grown into a Tableau Forums rockstar—helping others in the community with their Tableau questions.
After getting started with Tableau, Viviane understood the basics of the product but what kept her coming back was participating in Tableau Conference 2022, learning about the DataFam, Tableau Public, community projects, and interacting with people who push Tableau to its limits.
Viviane began answering questions on the Tableau Forums on a whim but was hooked almost immediately. She initially used the Forums to find answers to her own questions but decided to see what the other side of the Forums looked like and was amazed at how many questions were out there. Not only does she enjoy answering questions to help Tableau newbies, but she’s also learned so much by trying out new things in Tableau in an effort to help answer them.
Viviane chooses to be involved through the Tableau Forums because she empathizes with users who are new to the product. An outside perspective can be so valuable for users who are deep into a visualization and a roadblock for one person may have a simple answer for someone with fresh eyes. Viviane also appreciates that the Forums provide a platform where an answer to a question doesn’t just stop with one person, rather the next person who has the same question can also refer to the same answer.
Connect with Viviane through Linkedin, Twitter, Tableau Public, on the Tableau Forums, and at Tableau Conference
Women's History Month with the Tableau Community
- Weekly Viz of the Day's Each week Tableau Public will be featuring a viz celebrating Women's History Month.
- Community Data Visualization Challenges: The DataFam has launched a series of data challenges celebrating Women's History Month. Check them out below!
- Data + Diversity: Navigating Your Career During Uncertain Times with Faith Ruto: Mar 30, 2023, 9:00 AM (PDT), Virtual Event - Faith Ruto, Executive Coach and former leader in Tech, will share practical strategies to navigate the workplace during uncertain times. Find balance in your work and home life and unlock the confidence that will help you achieve your career goals. This Women's History Month event will leave you feeling empowered and inspired to thrive in your career.
-
Back to Viz Basics - Visualize Data in a Timeline: As we celebrate International Women's Day and Women's History Month, it's important to recognize the incredible contributions that women have made to our world. In honor of this occasion, this week's data is on Nobel Prize laureates (a person who is honored with an award for outstanding creative or intellectual achievement), with a particular focus on the achievements of female laureates.
-
ProjectHealthViz - Impact of Endometriosis on in Vitro Fertilization Outcomes – Data set from a research paper and aims to highlight the invisible struggle many women with endometriosis face when trying to get pregnant. March is Women’s History Month and it’s important to bring awareness to fertility struggles and the huge hurdles women and their partners go through in hopes of having a family.
-
Diversity in Data - A compilation by Thoughtco.com of the 100 most popular women in history by internet searches
-
DataFam content
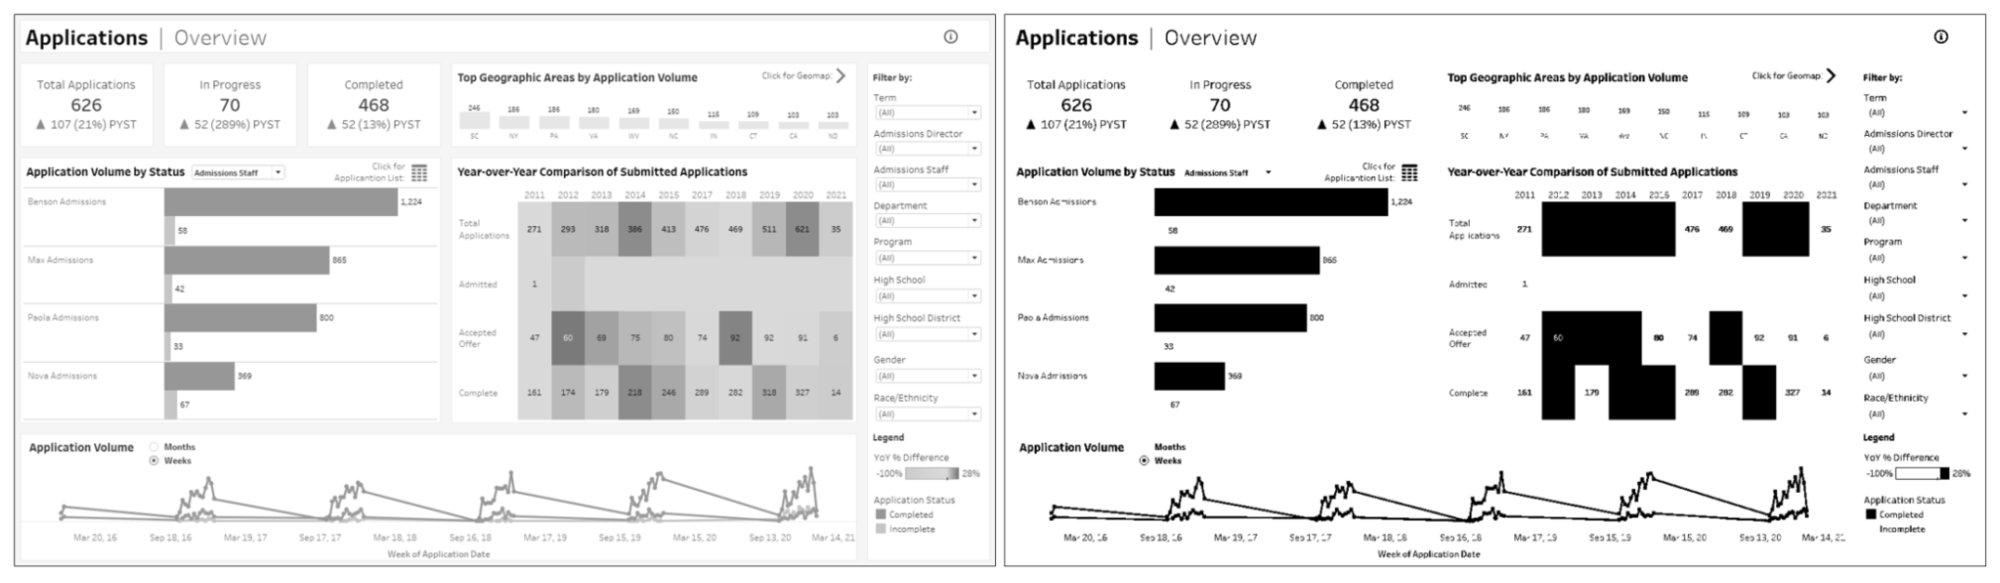
Bridget Cogley, Tableau Fit: Uplifting a Tableau Accelerator to Design, Delight, and Deliver for an Education Admissions Dashboard – Part 1: Assessment
Dive into content created by the Tableau Community:
- Jellyman Education: How to Customize Action Filters for Specific Dimensions | Tableau Desktop
- Ken Flerlage, The Flerlage Twins: Embedding Social Media in Tableau
-
Abhishek Nag, DataVizard: 8 PRACTICES - That helped me land a Data Visualisation job || Tableau || SQL
-
Yupeng Wu: What's New - Tableau 2023.1新功能_哔哩哔哩_bilibili
-
Prasann Prem:
-
Bridget Cogley, Tableau Fit: Uplifting a Tableau Accelerator to Design, Delight, and Deliver for an Education Admissions Dashboard – Part 1: Assessment
-
Jade Wimpey, dataunjaded: Data Viz Spotlight: Dashboard Discovery
-
Jon Schwabish, Policy Viz: Episode #234: Kirk Munroe
-
Alexander Mou, Vizible Difference: A Couple of Mismatches in Tableau's Map
-
Michael Sandberg: GPT4 Creates a Love Poem to Tableau
-
Zach Bowders, Data + Love: Generative AI Revolution w/ Jeff Shaffer
-
Andy Kriebel, VizWiz: How to Master Containers in Tableau
Team Tableau
-
Celebrating the DataFam and 3 Million Profiles on Tableau PublicAnnouncing the 2023 Tableau Visionaries
Upcoming events and community participation
-
The 2023 Vizzies Award Nominations: The Tableau World Podcast established the Vizzies as a way to recognize individuals in the Tableau community who are not recognized through the visionary program. It is our goal that these awards are diverse and inclusive of the Tableau community. So without further ado, we present the 8th Annual Vizzies. Nominations are open through March 31st. Winners will be announced live on stage at TC23! How do you nominate someone? It's super easy. Just fill out the nomination form by typing in the person's name.
-
Data Super Star: The theme of this competition is insightfulness, navigability, and user-friendliness. We are looking for BUSINESS DASHBOARDS that effectively communicate key insights and patterns in the data, allow for easy exploration, and provide a positive user experience.
-
Dataviz Conferences to not miss in 2023 Are you ready to join the global dataviz community? Fortunately, there are a number of amazing conferences held throughout this year that can help you network with your peers, uncover new learnings, give you memories, and lot of fun. Let’s check them.
-
Data Superstar: Get ready for a data visualization extravaganza! Our competition is all about showcasing the best and brightest in data visualization. The theme of this competition is insightfulness, navigability, and user-friendliness. We are looking for visualizations that effectively communicate key insights and patterns in the data, allow for easy exploration, and provide a positive user experience.
-
Community Calendar and Upcoming Events: stay up-to-date on the latest Women in Dataviz events and other data visualization-related events. If you'd like to submit an event to the calendar, please fill out this form.
Vizzes
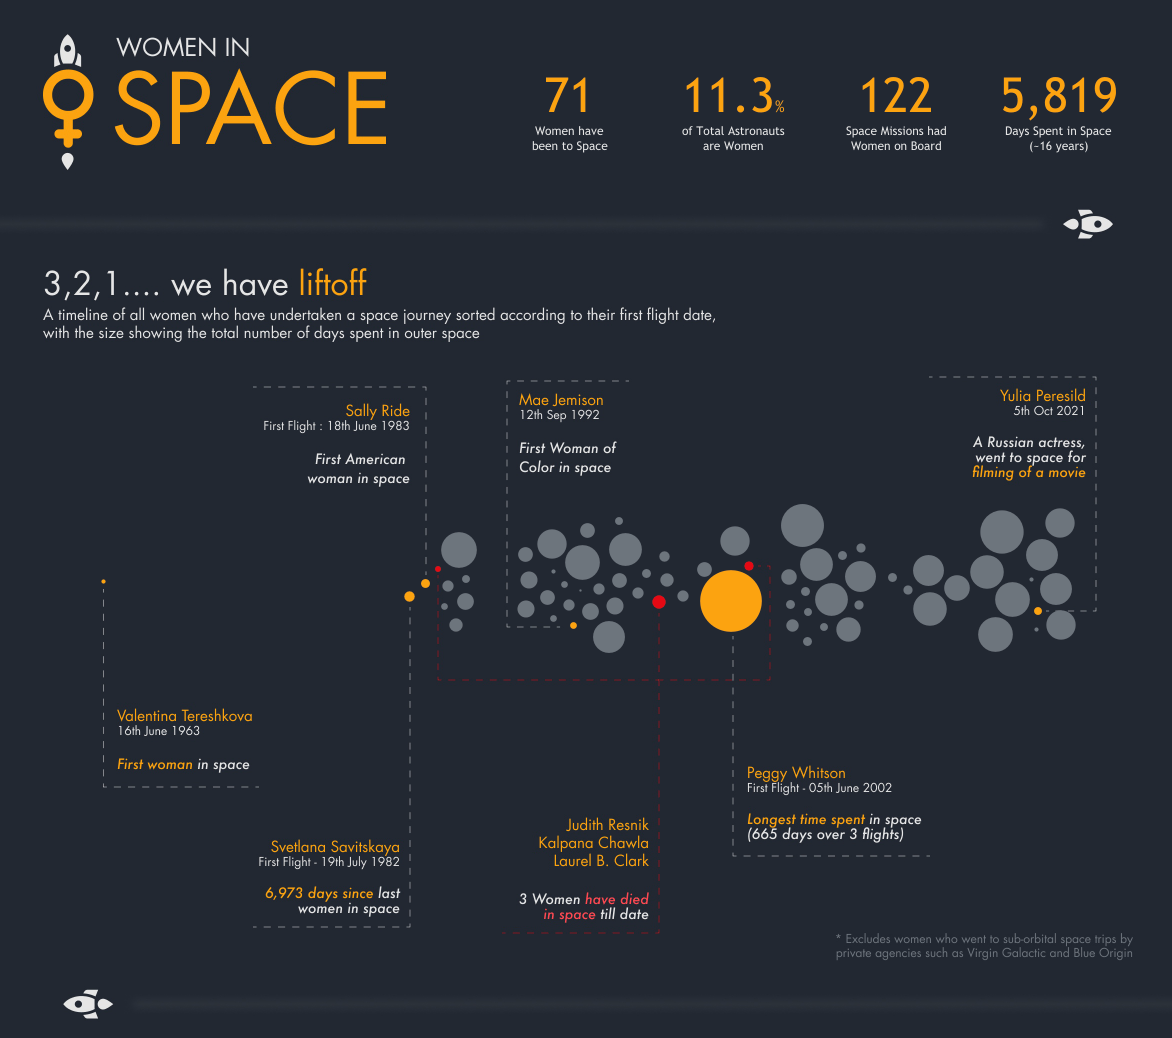
Varun Jain: Women in Space
See the latest Viz of the Day, trending vizzes, featured authors, and more on Tableau Public.
Check out some inspirational vizzes created by the community:
-
Saverio Rocchetti: We need your touch Blog_Viz
-
Zsofia Nika: Snowfall in Hungary since 1901
-
Varun Jain: Women in Space
Community Projects
Back 2 Viz Basics
A bi-weekly project helping those who are newer in the community and just starting out with Tableau. Not limited just to newbies!
Web: Back 2 Viz Basics
Twitter: #B2VB
Week 6: Use Brand Colors
Workout Wednesday
Build your skills with a weekly challenge to re-create an interactive data visualization.
Web: Workout Wednesday
Twitter: #WOW2022
Week 12: Can you build a dashboard using containers?
Makeover Monday
A weekly social data project.
Web: Makeover Monday
Twitter: #MakeoverMonday
Week 12: U.S. Wind Turbines
Preppin' Data
A weekly challenge to help you learn to prepare data and use Tableau Prep.
Web: Preppin’ Data
Twitter: #PreppinData
Week 12: Regulatory Reporting Alignment
DataFam Con
A monthly challenge covering pop culture and fandoms.
Web: DataFam Con
Twitter: #DataFamCon
February 2023: (Reality) Love is in the Air!
EduVizzers
A monthly project connecting real education data with real people.
Web: Eduvizzers
March 2023: Strategic Measure Number of Apprenticeship and Internship Positions Offered by the City of Austin
Games Night Viz
A monthly project focusing on using data from your favorite games.
Web: Games Nights Viz
Twitter: #GamesNightViz
Level 6: The Final Boss
Iron Quest
Practice data sourcing, preparation, and visualization skills in a themed monthly challenge.
Web: Iron Quest
Twitter: #IronQuest
Storytelling with Data
Practice data visualization and storytelling skills by participating in monthly challenges and exercises.
Web: Storytelling with Data
Twitter: #SWDChallenge
March 2023: remake a famous graph
Project Health Viz
Uncover new stories by visualizing healthcare data sets provided each month.
Web: Project Health Viz
Twitter: #ProjectHealthViz
March 2023: Impact of Endometriosis on in Vitro Fertilization Outcomes
Diversity in Data
An initiative centered around diversity, equity & awareness by visualizing provided datasets each month.
Web: Diversity in Data
Twitter: #DiversityinData
March 2023: Women's History Month
Sports Viz Sunday
Create and share data visualizations using rich, sports-themed data sets in a monthly challenge.
Web: Sports Viz Sunday
Twitter: #SportsVizSunday
January 2023: Is it a Sport or a Game?
Viz for Social Good
Volunteer to design data visualizations that help nonprofits harness the power of data for social change.
Web: Viz for Social Good
Twitter: #VizforSocialGood
Mar 23 - Apr 18, 2023: World Health Organization (WHO)
Real World Fake Data
Create business dashboards using provided data sets for various industries and departments.
Web: Real World Fake Data
Twitter: #RWFD
Session 5: Diversity Score Card
Data Plus Music
A monthly project visualizing the data behind the music we love!
Web: Data Plus Music
Twitter: #DataPlusMusic
관련 스토리

DataFam Roundup June 2026

DataFam Roundup May 2026

Iron Viz 2026: Read Between the Data
 2026/05/28