Add Natural Language Explanations to Dashboards with Tableau Data Stories


The quest for timely, accurate, and actionable insights is perennial in the ever-evolving data analytics landscape. Business users and data analysts alike grapple with the challenge of translating vast swathes of data into meaningful narratives. Enter Data Stories—a groundbreaking feature from Tableau that promises to reshape how we perceive and interact with data. Let's delve into its intricacies and implications for the modern data professional.
Even with the advancements in data visualization tools and platforms, many users need help with dashboards. While dashboards are designed to simplify and visualize complex datasets, they are only sometimes intuitive for the average user, especially if the dashboard was not built explicitly for them. The maze of charts, graphs, and numbers can obfuscate rather than clarify. Extracting salient insights often demands more than a cursory glance; it requires an effortful dive into the data, a knack for discerning patterns, and a familiarity with the dashboard's design logic. This learning curve and the urgency of business decisions can leave users feeling overwhelmed and underserved, hindering the very purpose dashboards are meant to serve. This is where Data Stories come in.
What are Tableau Data Stories?
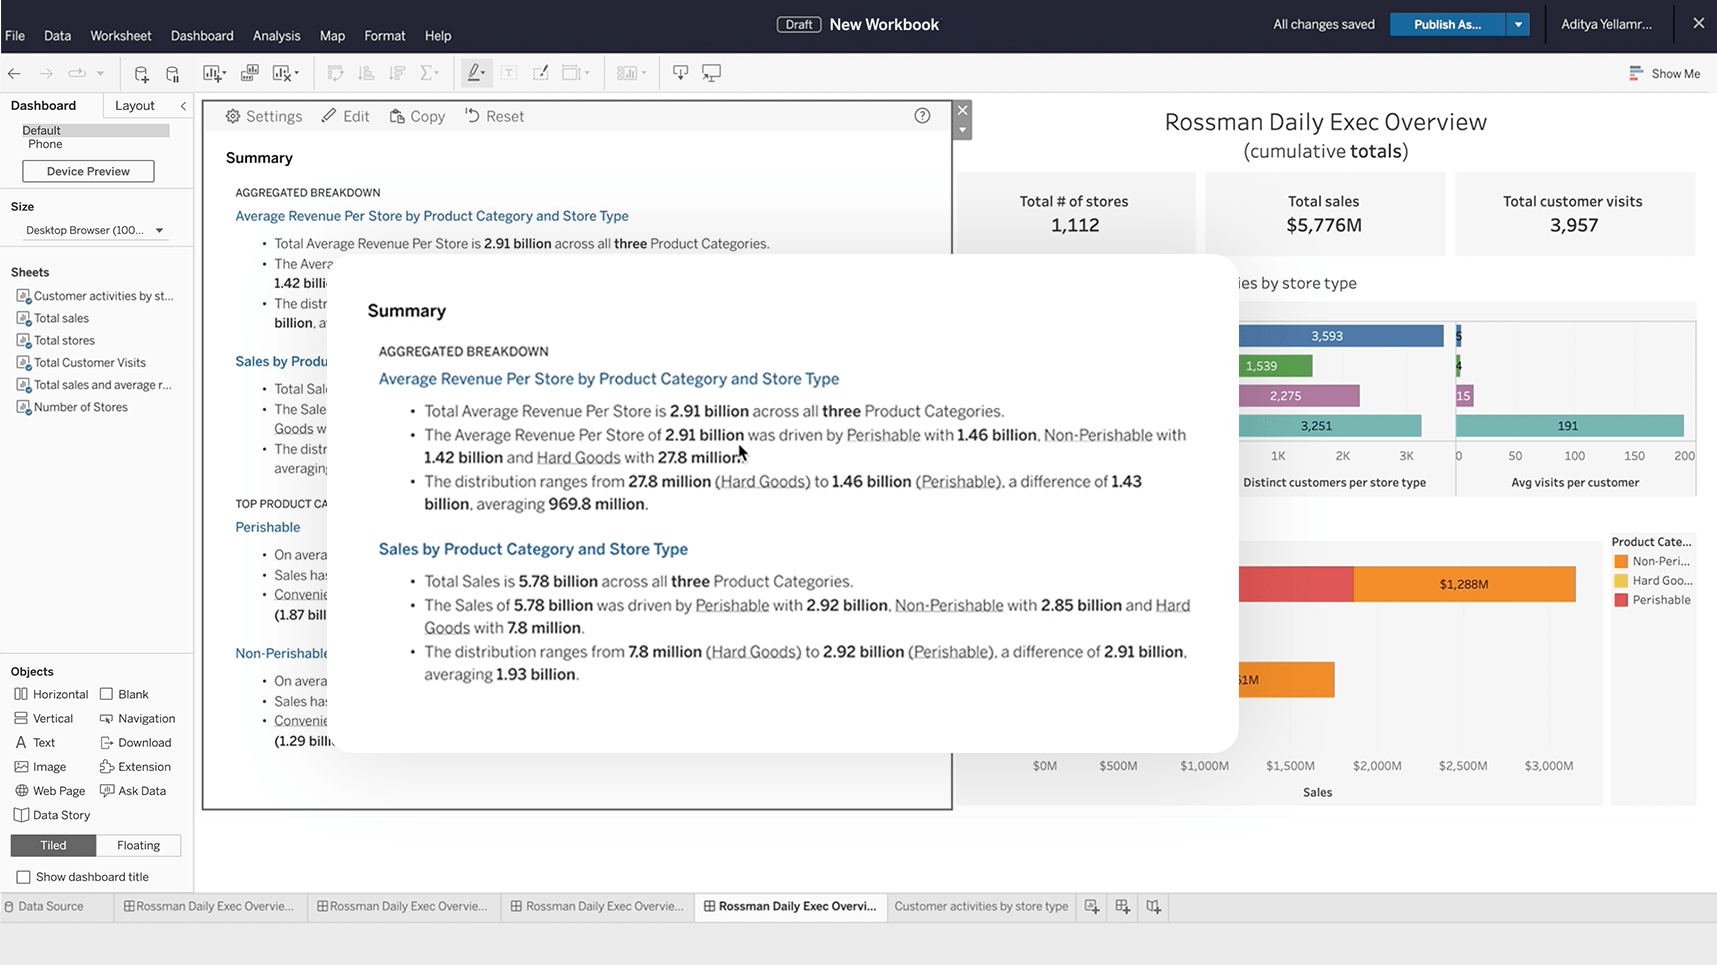
Tableau Data Stories is a feature in Tableau that automates the creation of narrative insights within Tableau dashboards. This tool is designed to save time and enhance the understanding of data visualizations by automatically generating summaries or "stories" about the data presented in the dashboard. It uses rules-based templated natural language generation (NLG) to create easy-to-digest stories.
The benefits of Tableau Data Stories include:
- Reduce Time Manual Reporting: The future is automated, and so is your reporting with Data Stories. Spend less time crunching numbers and more time strategizing with automatically generated plain-language explanations of your vizzes and dashboards at the click of a button.
- Clearer Insights: Reduce the risk of misinterpretation and making an incorrect or noncompliant business decision. Given the robust analysis, you also get relevant insights that may have been overlooked.
- Boost Your Data Game: Automate data professionals' time manually writing commentary that explains their data analysis.
Tableau uses a service hosted in your Tableau Cloud or Tableau Server environment to write Data Stories. When you add a Data Story to a dashboard or view a Data Story from a dashboard, Tableau sends associated worksheet data to the environment that you’re logged in to (i.e., your Tableau Cloud site or your Tableau Server instance) using the security standards outlined in Security in the Cloud and Security in Tableau Server. Data Stories can be written and viewed from anywhere you use Tableau.
Getting Started with Data Stories
1. Access: The first step is to log into your Tableau Cloud or Tableau Server account. (Psst! Data Stories is generally available on both platforms.)
2. Integrate: You'll find the Data Story object on your dashboard. Simply drag and drop it to your desired location.
3. Configure: Tailor your Data Story inputs with a few intuitive clicks. Update the number formatting, sentiment, and dimension labels and measure names to ensure the narratives resonate with your business's unique lexicon.
As your data evolves, so will your Data Stories with dynamic, real-time insights presented in an easily-digestible format. And this is just the beginning—you can add a pop-up Data Story to your dashboard, create custom measure relationships in your Data Story, or use a table calc in your Data Story. Learn even more about how to create a Tableau Data Story.
Your Next Steps to Automated, Easy-to-Understand Descriptions in Your Dashboards
Now is your moment if you've ever hesitated about delving into data analytics. Data Stories isn't just a tool—it's a bridge to a world where data becomes stories, insights become actionable, and every team member becomes a data analyst in their own right.
Are you still pondering? Don't! Dive into Data Stories now and discover a new dimension of data analytics. Embrace the narrative. Embrace the future. And remember, every story starts with a single data point. What will yours say?
関連ストーリー

Extend Access to Embedded Tableau Content with On-Demand Access
 2026/07/22

What is Tableau Prep?
 2026/04/30
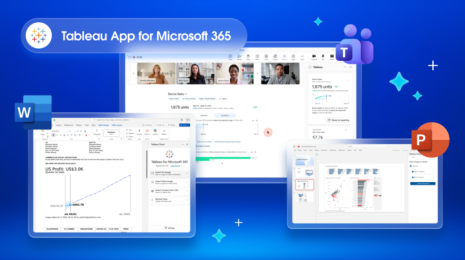
あらゆる業務環境でインサイトを取得: Microsoft 365 用の Tableau アプリ登場
 2026/03/16