Quick tips for preparing survey data in Tableau Prep


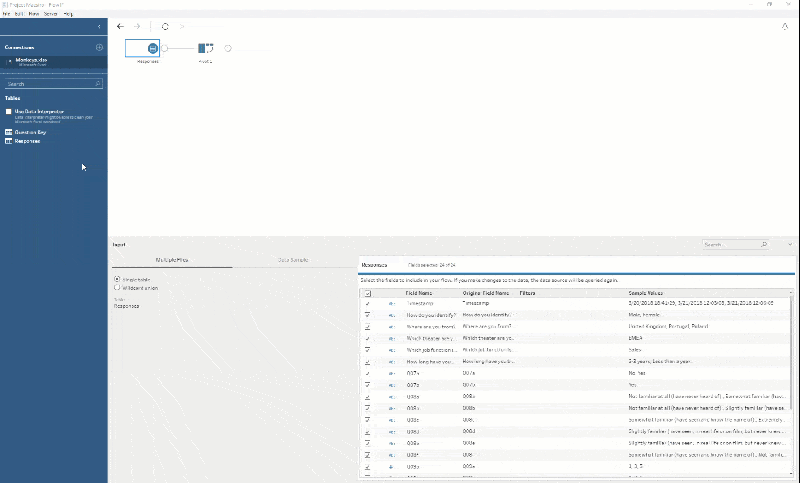
As a Tableau product consultant, I’ve seen how difficult it can be to prepare survey data for analysis. In a previous post, I explained how to prepare survey data in Tableau Desktop. In this post, we’ll focus on how to prepare survey data in Tableau’s new data prep product, Tableau Prep. When the Tableau Prep (previously Project Maestro) beta was released, I was thrilled to have a visual, direct way to prepare this complex data.
With SurveyMonkey being one of the most common tools for distributing surveys and collecting responses, I thought it’d only be fitting (and fun) to gather some survey data from my team around various monkey-related topics. Here’s how I went about preparing this data in Tableau Prep:
Step 1: Pivot in the flow pane
Once I’ve connected to the data and added it to the flow pane as an input, I can add my first step in the flow—a pivot. I can select the fields I want to pivot — remember with survey data this will usually exclude the respondent ID and any demographic information — then drag and drop them from the profile pane to the ‘pivot field values’ column. I’ll also rename the new fields “Question Key” and “Responses.” respectively.

Step 2: Join data set
You might have noticed that in this dataset, the questions are coded with a key rather than the text of the question itself. Sometimes survey data requires using a lookup table with the question keys and the questions. We can easily drag the secondary lookup table from the connections pane on the left to the flow pane. Tableau Prep automatically recognises the common key we want to use between the two tables so all we have to do is specify the join type in the recipe call out to the left of the profiles.
Step 3: Clean up your data
From here, we can add steps to our flow to further clean and prepare our data to make the analysis as simple as possible once we export it to Tableau.
I’ll start by grouping common response types (e.g. Likert scale, yes/no, etc.). In this example, the question key from the original data already helps me do this since parts of a question share the same question number.
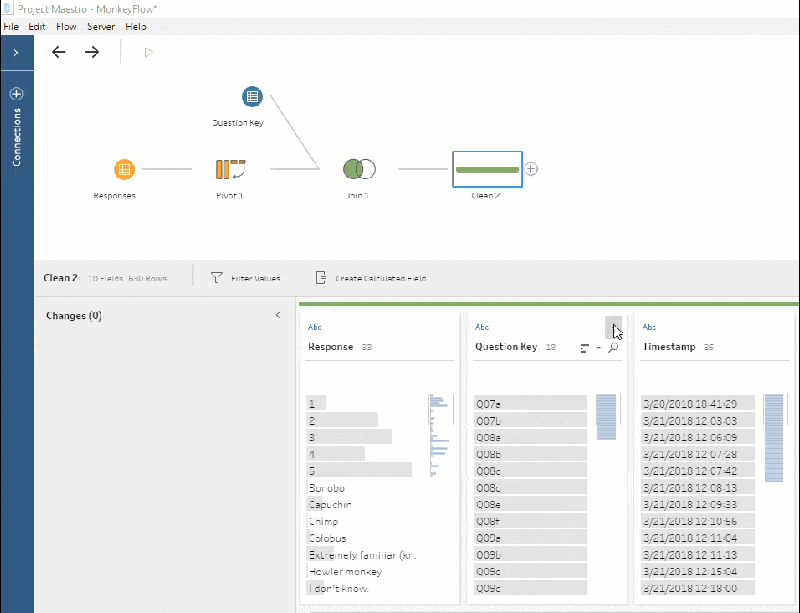
Using the Group by Pronunciation feature in Tableau Prep, we can correct open-text responses where respondents made spelling mistakes and group answers that were provided in slightly different formats, such as mixed cases or trailing spaces.

Step 4: Output your data set
Finally, you can output the data to your chosen file type. I’ll go with .hyper so that I can dive straight into visualising this data in Tableau. Explore my my final workbook to see how my coworkers responded to the survey:

Try Tableau Prep today
- Learn more about Tableau Prep
- Explore free training videos to become a data prep master
関連ストーリー

VizQL Data Service from Tableau: Use Your Data, Your Way
 2024/08/08

When and How to Use Multi-fact Relationships in Tableau
 2024/08/01

Top data books of 2021
 2021/12/12