DataFam Roundup: May 22 - 26, 2023


Welcome! Dig into this week's DataFam Roundup—a weekly blog that brings together community content all in one post. As always, we invite you to send us your content—and the DataFam content from your peers that have inspired you! Find the content submission form here.
Community Highlight
To recognize new and consistent Tableau contributors—we’re excited to have a section within the weekly DataFam Roundup called the Tableau Community Highlight. Find out how to get involved.

Priya Yogendra Rana, Senior Consultant - Business Intelligence at Axtella Consulting
Mumbai, India
Priya Yogendra Rana is a Business Intelligence Senior Consultant at Axtella Consulting. She stays active in the community by participating in community projects such as MakeoverMonday, VizforSocialGood and WorkoutWednesday and shares her Tableau knowledge through her blog on Medium.
Priya’s blog began as part of a project to complete a course but upon reflection, she realized that she had looked for blogs that were easy to follow when she started learning Tableau – so she decided to create that experience for others. On her blog, she prioritizes ease of comprehension and chooses topics that she has figured out on her own or that have not been covered elsewhere.
In her free time, Priya also enjoys creating vizzes on topics that interest her. Some vizzes Priya has published on Tableau Public include: India’s Wildlife, Women’s Economic Empowerment Globally, and The Music Industry in the Last 40 Years, among others. Priya draws inspiration from topics that enable her to learn something new and that connect with the history, nature, popular culture, and social issues of India.
Connect with Priya on Linkedin, Twitter, Tableau Public, and on her blog.
DataFam content
Ken Flerlage, The Flerlage Twins: Synchronized Scrolling in Tableau
Dive into content created by the Tableau Community:
-
Eric Balash: Back 2 Viz Basics: 2023/Week 9 - Build a Bar Chart
-
Will Sutton: Could Tableau Public & Tableau Prep Be a Single Product? True to the Core
-
Sarah Bartlett, Sarah Loves Data: Tableau Conference Reflections 2023 #data23
-
Adam Mico: #Data23 | My Five Takeaways from the 2023 Tableau Conference
-
Niels Meijer: Tableau #datafam is the pinnacle of ED&I
-
Ken Flerlage, The Flerlage Twins: Synchronized Scrolling in Tableau
-
Jennifer Dawes, herdata: TABLEAU ONLINE - METADATA EXERCISE #1
-
Autumn Battani: Ten Tiny Tableau Tips
-
Luke Stanke: How to Replace Null/Blank Values with Zeros in Tableau
-
Candra McRae, The Data Leadership Collaborative: Seven Attributes of a True Data Leader
-
Ansula Jain, Techi Anshi: How to add rounded containers and sheet on a Tableau Dashboard
-
Zach Bowders, Data + Love: Conference Talk, Empowering Users and Community with Ryan Aytay
-
Nicole Mark, Maven: The Ultimate Data Visualization Pre-Publication Checklist
-
Kevin Wee: How to Assemble THIS Tableau Dashboard In 12 Minutes (Demo)
-
Brittany Rosenau: Building your first Data Viz Checklist
-
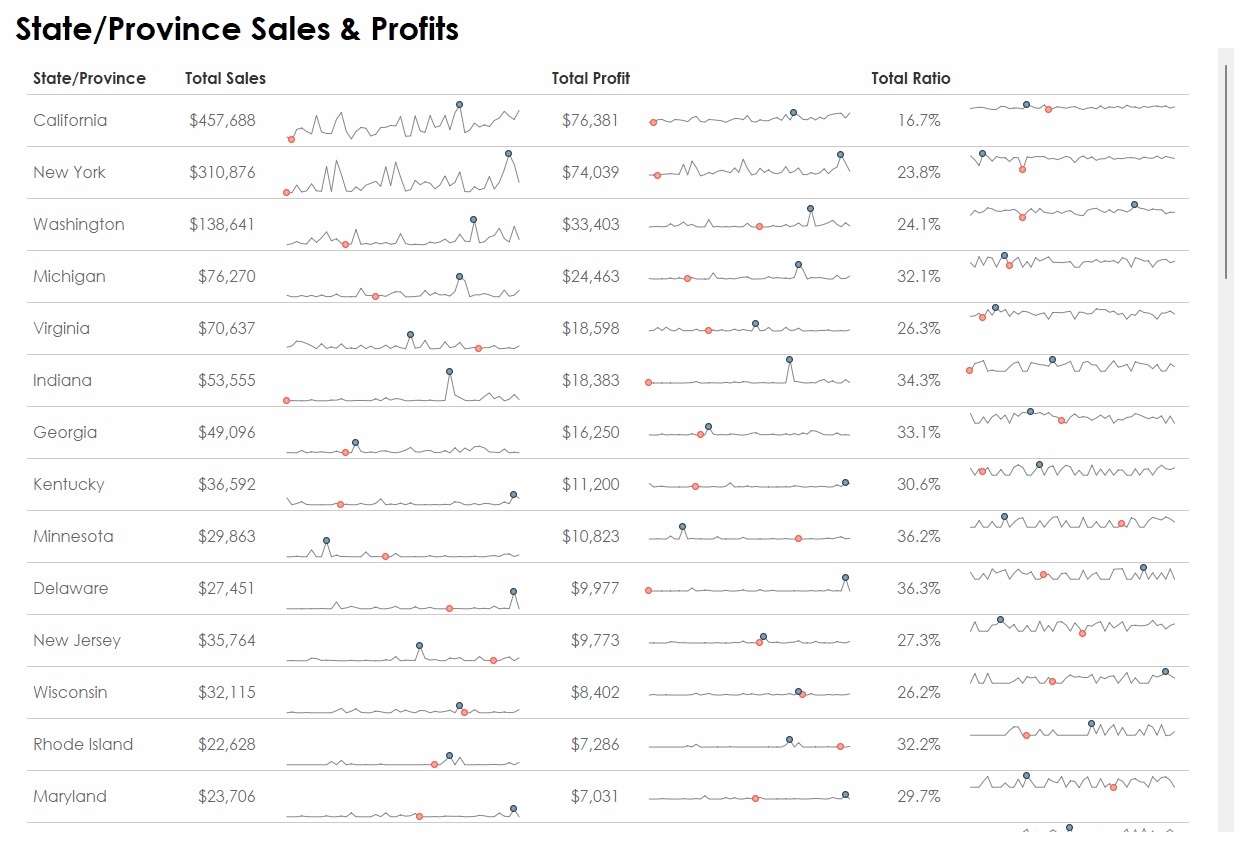
Sean Miller: Tableau #WOW2023 Livestream | Week 21 | Profit vs Target
-
Dinushki De Livera and Jennifer Dawes, herdata: DATA LEARNS: TABLEAU RELATIONSHIPS
-
Rajeev Pandey, vizartpandey:
Team Tableau
-
2023 Iron Viz finalists made earth their viz-ness at Tableau Conference
-
Closing the (ideas) loop: Update re. Tableau product ideas, features & releases
Upcoming events and community participation
-
Analytics Engineering Meetup: Tableau Visionary Anya Prosvetova will share several data source optimisation techniques for your Tableau workbooks.
-
Madison Tableau User Group 10th Birthday: We are celebrating our Madison TUG's 10th birthday! Please record a quick video or message about a fun memory you have from a past event or how participation in TUG may have helped you in your journey.
-
Iron Viz '23 Quest Trailmix: Iron Viz is the world's largest data visualization competition. Quest on and become a fan!
-
Data Book Club: This spring we'll be reading Avoiding Data Pitfalls: How to Steer Clear of Common Blunders When Working with Data and Presenting Analysis and Visualizations by Ben Jones.
-
TrailblazerDX ’23 Tableau Quest: Leverage the power of data with the world’s leading analytics platform to drive better business decisions.
-
Community Calendar and Upcoming Events: stay up-to-date on the latest Women in Dataviz events and other data visualization-related events. If you'd like to submit an event to the calendar, please fill out this form.
Vizzes
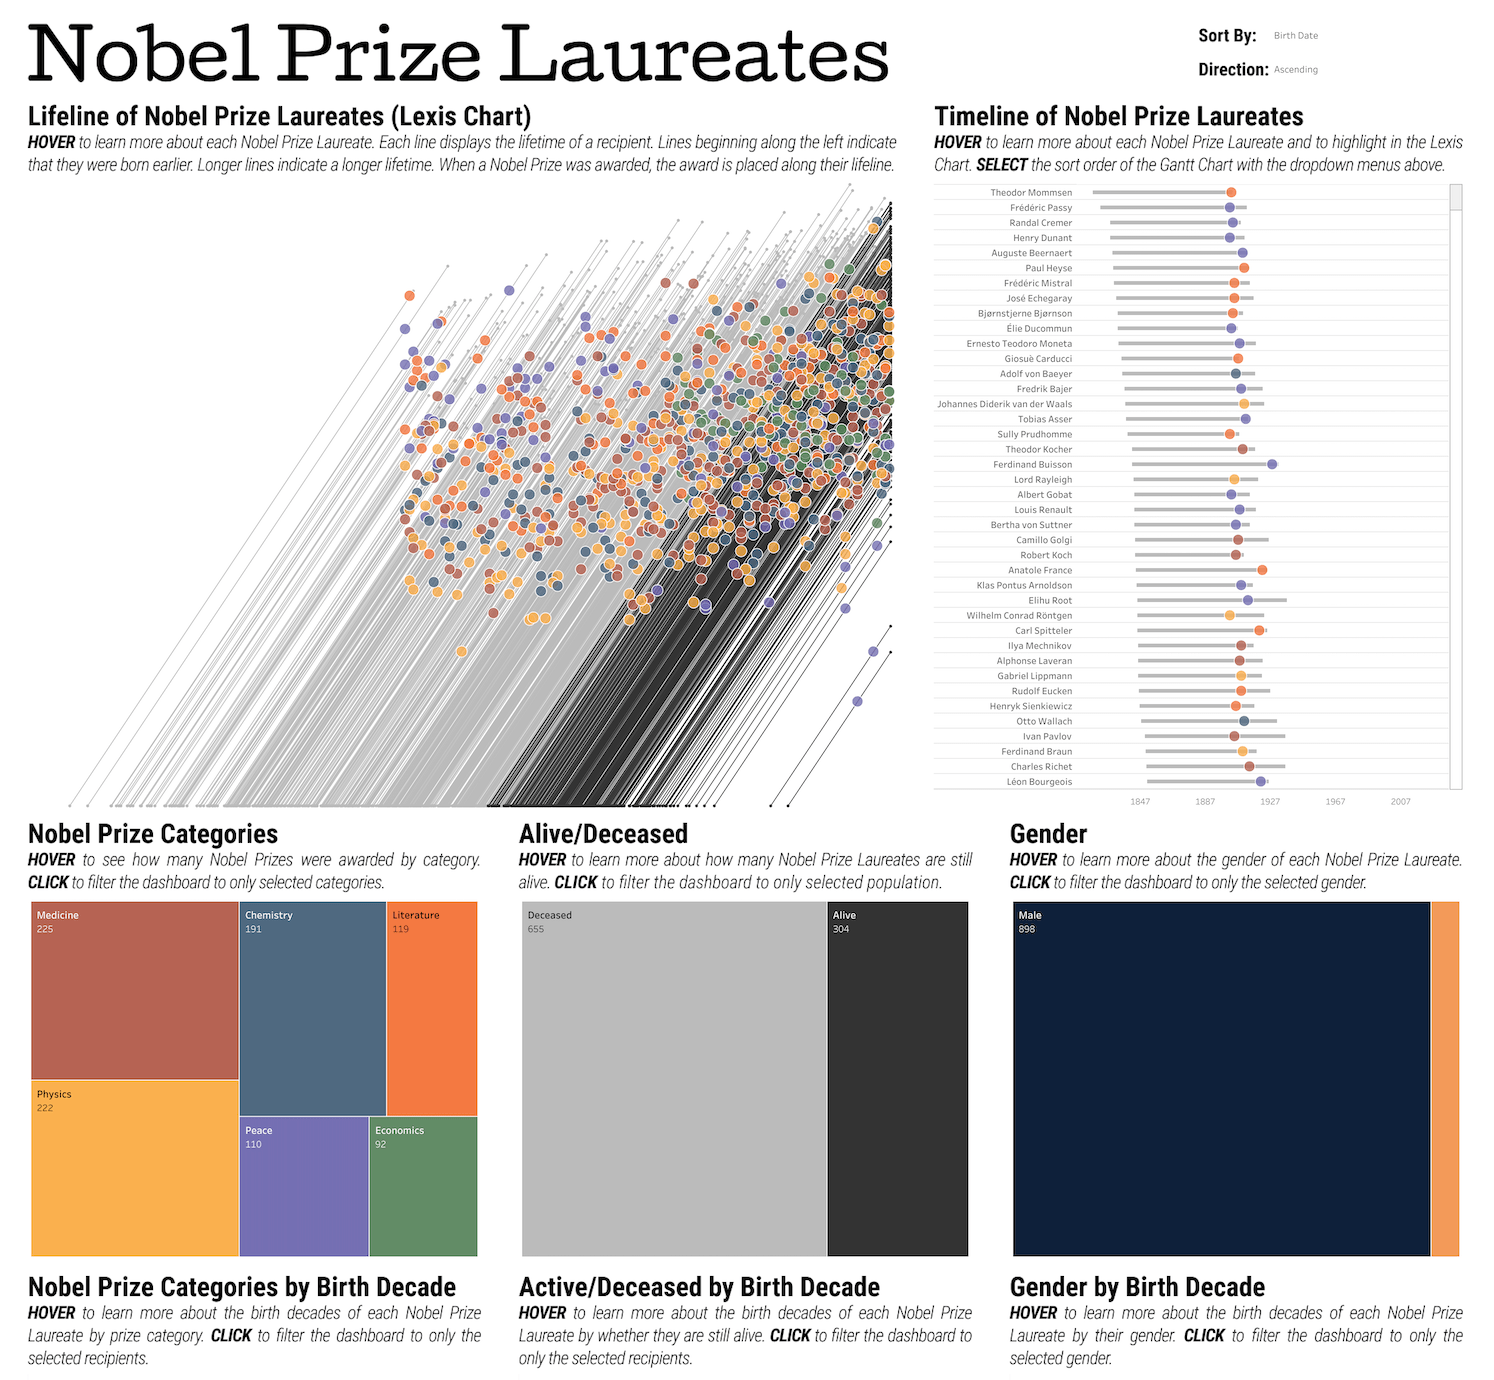
Sam Epley: #B2VB 2023 Week 5: Nobel Prize Laureates
See the latest Viz of the Day, trending vizzes, featured authors, and more on Tableau Public.
Check out some inspirational vizzes created by the community:
-
Kevin Wee 黃克文: Great Divide on Homosexuality Acceptance (ternary plot w/ reference lines)
-
Chimdi Nwosu: Press Freedom Index : The Dire State of Authentic Journalism in 2023
-
Tobi Williams Babatunde: Afrobeats Music Video Patterns v2
-
Sam Epley: #B2VB 2023 Week 5: Nobel Prize Laureates
-
Tamás Varga: World Press Freedom Index 2023
-
Tina Covelli: The Spike in Stolen Bases: 2023 MLB New Rules Series
-
Dashboard Temple: Premium Business Dashboard Template
Community Projects
Back 2 Viz Basics
A bi-weekly project helping those who are newer in the community and just starting out with Tableau. Not limited just to newbies!
Web: Back 2 Viz Basics
Twitter: #B2VB
Week 10: Build a Table
Workout Wednesday
Build your skills with a weekly challenge to re-create an interactive data visualization.
Web: Workout Wednesday
Twitter: #WOW2022
Week 21: Profit vs Target (with Tolerance)
Makeover Monday
A weekly social data project.
Web: Makeover Monday
Twitter: #MakeoverMonday
Week 21: FDA Product Recalls
Preppin' Data
A weekly challenge to help you learn to prepare data and use Tableau Prep.
Web: Preppin’ Data
Twitter: #PreppinData
Week 21: Prep School Grades
DataFam Con
A monthly challenge covering pop culture and fandoms.
Web: DataFam Con
Twitter: #DataFamCon
April 2023: Kids Month!
EduVizzers
A monthly project connecting real education data with real people.
Web: Eduvizzers
May 2023: 2021 Reported Energy and Water Metrics (Boston)
Games Night Viz
A monthly project focusing on using data from your favorite games.
Web: Games Nights Viz
Twitter: #GamesNightViz
Level 6: The Final Boss
Iron Quest
Practice data sourcing, preparation, and visualization skills in a themed monthly challenge.
Web: Iron Quest
Twitter: #IronQuest
Advanced Chart Types
Storytelling with Data
Practice data visualization and storytelling skills by participating in monthly challenges and exercises.
Web: Storytelling with Data
Twitter: #SWDChallenge
May 2023: making or missing the mark
Project Health Viz
Uncover new stories by visualizing healthcare data sets provided each month.
Web: Project Health Viz
Twitter: #ProjectHealthViz
May 2023: WHO’s Global Report on Health Equity for Persons with Disabilities
Diversity in Data
An initiative centered around diversity, equity & awareness by visualizing provided datasets each month.
Web: Diversity in Data
Twitter: #DiversityinData
May 2023: Mental Health Awareness Month
Sports Viz Sunday
Create and share data visualizations using rich, sports-themed data sets in a monthly challenge.
Web: Sports Viz Sunday
Twitter: #SportsVizSunday
January 2023: Is it a Sport or a Game?
Viz for Social Good
Volunteer to design data visualizations that help nonprofits harness the power of data for social change.
Web: Viz for Social Good
Twitter: #VizforSocialGood
Apr 18 - June 6, 2023: World Health Organization (WHO)
Real World Fake Data
Create business dashboards using provided data sets for various industries and departments.
Web: Real World Fake Data
Twitter: #RWFD
Session 5: Diversity Score Card
Data Plus Music
A monthly project visualizing the data behind the music we love!
Web: Data Plus Music
Twitter: #DataPlusMusic
関連ストーリー

DataFam Roundup June 2026

DataFam Roundup May 2026

Iron Viz 2026: Read Between the Data
 2026/05/28