DataFam Roundup February 2026


Welcome! Dig into this month's DataFam Roundup—a monthly blog that brings together community content all in one post. As always, we invite you to send us your content—and the DataFam content from your peers that have inspired you! To send us your content, join the Tableau Community workspace on Slack and join the #community-share channel.
Community Highlight
To recognize new and consistent Tableau contributors—we’re excited to have a section within the monthly DataFam Roundup called the Tableau Community Highlight. Find out how to get involved.

Juba Asma, Tableau Lead
Paris, France
Juba Asma is a Tableau lead who pivoted from network security to data visualization. He discovered Tableau during an apprenticeship for his Masters program, his immediate passion led him to transition from a self-taught enthusiast to a professional graduate of The Information Lab’s intensive Data Academy. Currently, Juba leads a community of over 100 creators, focusing on governance, creating administrative monitoring dashboards, and training users—ranging from beginners (Desktop & Prep) to advanced creators through dedicated best-practice workshops on performance and design.
Deeply committed to community engagement, Juba is a frequent speaker at Tableau User Groups and recently presented on the intersection of Tableau and AI, covering innovations like Tableau Pulse and MCP. Looking ahead, Juba remains focused on pushing the boundaries of the platform to help others discover the latest features while exchanging ideas on diverse and complex use cases.
Connect with Juba on Linkedin and Tableau Public.
DataFam Content
Blogs
- Joshua Vijeh: Pair Your Technical Library with Live Data Using MCP
- Fi Crocker: Why You Should Go to Tableau Conference (At Least Once in Your Career)
- Jacob Rothemund and Chris McClellan: Embed YouTube into Tableau Dashboards
- DataFamXpress: A Student’s & Professional Guide to Learning Tableau
- Kat Rocha: My Top 10 Most-Used Tableau Tips & Tricks
- Sarah Pallett: Labeled Segmented Bars in Tableau: At-a-Glance Bars for Quick Insight
- Blake Feiza: Stop Overthinking Trellis Charts: Two Calculations
- Tanner Ladd: Why Row-Level Security in Tableau Matters (Part 3)
- Cooper Wenhua with Adam Mico: From Tableau Prep Clicks to Code (Without Becoming a Python Expert)
- Brittany Rosenau: New Spam Controls in Tableau Public
- Celia Fryar & Blake Wade: Designing for Trust, Not Just Answers
- Johan de Groot: Create a Radarchart in Tableau – Modular and Simple
- Matthias Giger: How to Generate a Bespoke Introduction to...Anything Using AI in Tableau
- Fi Crocker & Sarah Burnett: From Tableau Tips to Visionary Impact: Celebrating 10 Years with the Flerlage Twins
- Luigi Cicciari:
- Deepak Holla:
- Tarun Gupta:
Videos
- Deepak Holla:Labels to match Mark color || #Tableau "Quick Tips" Series
- Heather Cox, Kimly Scott, and Steve Wood: Grounds for Analysis: Sarah Burnett Brews Insights from Coffee Data | Ep 5 – Unfinished Vizness
- Louis Yu and Shreya Arya: Secrets of the Viz : Late-night snacks
- Fi Crocker, Sarah Burnett, Ken Flerlage, and Kevin Flerlage: D32 The Flerlage Twins on 10 Years, 451 Blog Posts & Why They're Not Stopping
Social Posts and Other Content
- Deepak Holla:
- Cooper Wenhua: Infrastructure as Code for Tableau Prep: An Experiment with Python and AI-Driven ETL
- Adam Mico with Ken Flerlage and Kevin Flerlage: The Flerlage Twins Companion GPT
Team Tableau Content
- Registration for Tableau Conference 2026 is open! Join us in San Diego May 5-7, 2026!
- Upcoming Webinar 3/18: The Context Gap: Why Accurate AI Needs a Semantic Layer
Visualizations
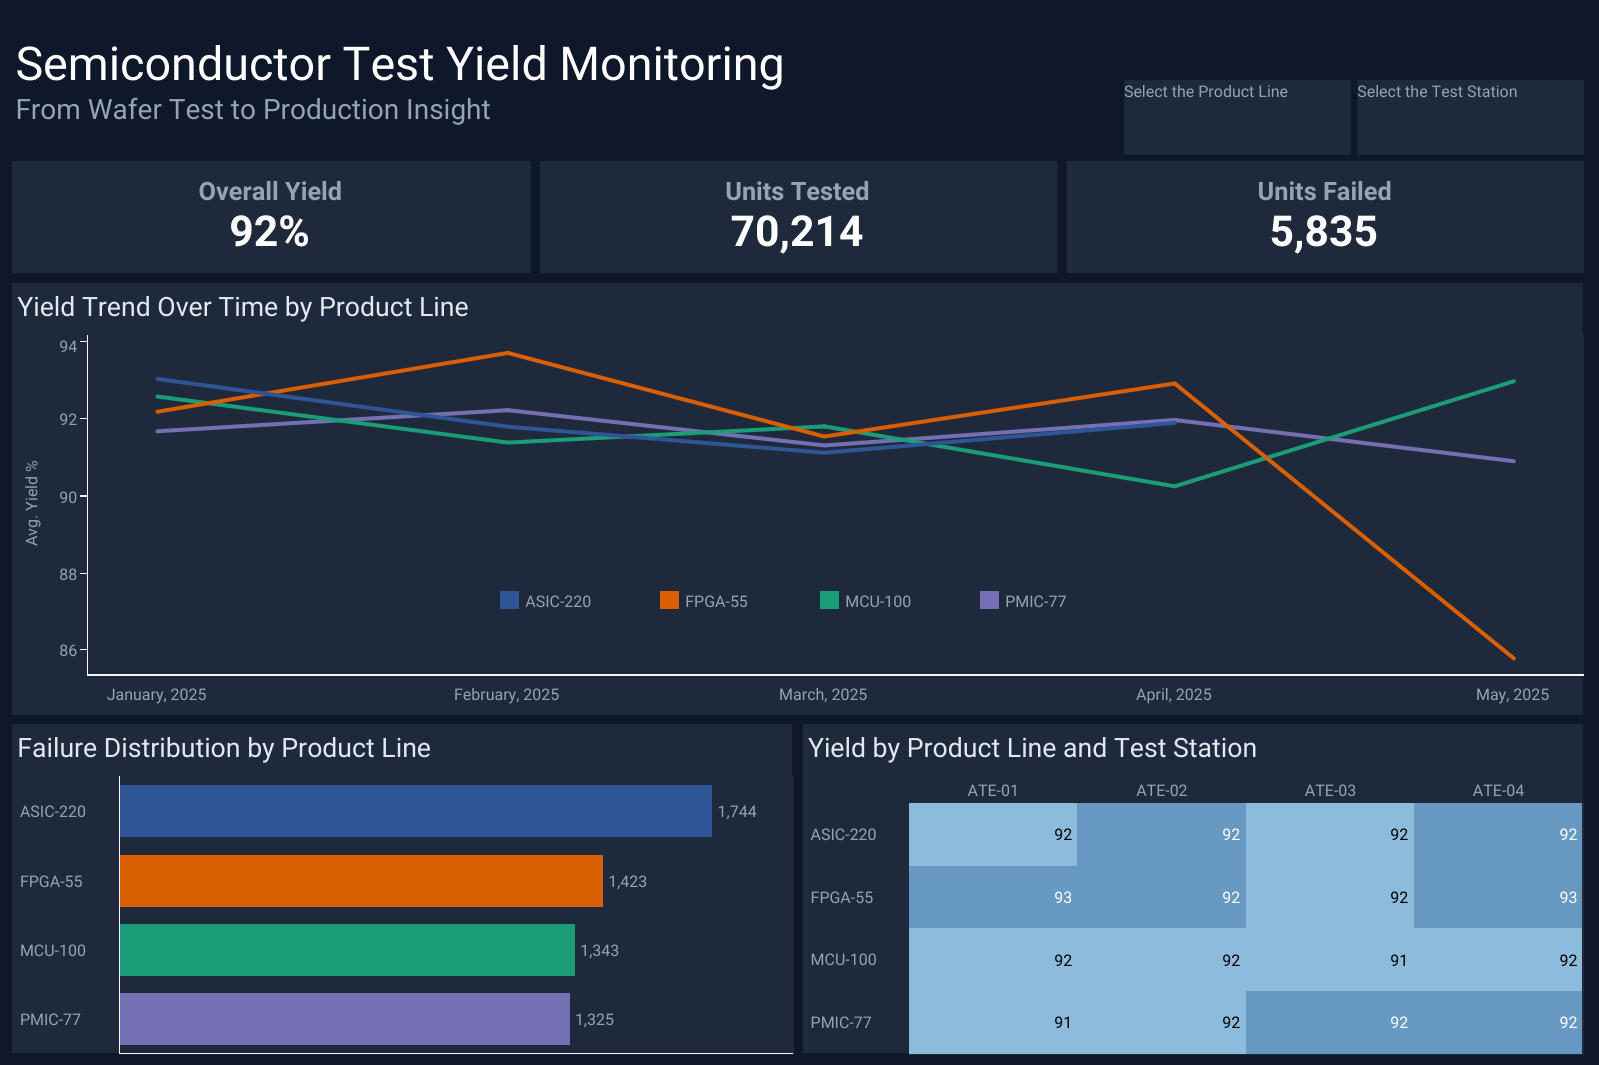
Deepak Holla: Semiconductor Test Yield Monitoring
See the latest Viz of the Day, trending vizzes, featured authors, and more on Tableau Public.
Check out some inspirational vizzes created by the community:
- Morgan Li: What You Should Know About 2026 Winter Olympics
- Myles Davenport: Medicolegal Death Investigation Dashboard - Proof of Concept
- Mark Bradbourne: Chart Selection Engine
- Blake Feiza: Satellite Charts in Tableau
- Sarah Burnett and Fi Crocker: Salesforce NZ Team Push Up Challenge 2026
- Matthias Giger:
Community Projects
Back 2 Viz Basics
A bi-weekly project helping those who are newer in the community and just starting out with Tableau. Not limited just to newbies!
Web: Back 2 Viz Basics
X: #B2VB
Workout Wednesday
Build your skills with a weekly challenge to re-create an interactive data visualization.
Web: Workout Wednesday
X: #WOW2022
Preppin' Data
A weekly challenge to help you learn to prepare data and use Tableau Prep.
Web: Preppin’ Data
X: #PreppinData
Makeover Monday
Create business dashboards using provided data sets for various industries and departments.
Web: Makeover Monday
X: #MakeoverMonday
Data ChangeMakers
Volunteer to design data visualizations that help nonprofits harness the power of data for social change.
Web: Data ChangeMakers
Visual Climate
Collaborate and share climate data.
Web: Visual Climate
X: #VisualClimate
DataFam Con
A monthly challenge covering pop culture and fandoms.
Web: DataFam Con
X: #DataFamCon
EduVizzers
A monthly project connecting real education data with real people.
Web: Eduvizzers
Games Night Viz
A monthly project focusing on using data from your favorite games.
Web: Games Nights Viz
X: #GamesNightViz
Iron Quest
Practice data sourcing, preparation, and visualization skills in a themed monthly challenge.
Web: Iron Quest
X: #IronQuest
Storytelling with Data
Practice data visualization and storytelling skills by participating in monthly challenges and exercises.
Web: Storytelling with Data
X: #SWDChallenge
Project Health Viz
Uncover new stories by visualizing healthcare data sets provided each month.
Web: Project Health Viz
X: #ProjectHealthViz
Diversity in Data
An initiative centered around diversity, equity & awareness by visualizing provided datasets each month.
Web: Diversity in Data
X: #DiversityinData
Sports Viz Sunday
Create and share data visualizations using rich, sports-themed data sets in a monthly challenge.
Web: Sports Viz Sunday
X: #SportsVizSunday
Real World Fake Data
Create business dashboards using provided data sets for various industries and departments.
Web: Real World Fake Data
X: #RWFD
Data Plus Music
A monthly project visualizing the data behind the music we love!
Web: Data Plus Music
X: #DataPlusMusic
BizViz52
A weekly project centered around designing business dashboards.
Web: BizViz52
X: #BizViz52
Storie correlate

DataFam Roundup June 2026

DataFam Roundup May 2026

Iron Viz 2026: Read Between the Data
 28 Maggio, 2026