DataFam Roundup August 18-22, 2025


Welcome! Dig into this week's DataFam Roundup—a weekly blog that brings together community content all in one post. As always, we invite you to send us your content—and the DataFam content from your peers that have inspired you! Find the content submission form here.
Community Highlight
To recognize new and consistent Tableau contributors—we’re excited to have a section within the weekly DataFam Roundup called the Tableau Community Highlight. Find out how to get involved.

Elijah Butler, Freelance Data Analyst
Kentucky, USA
Elijah Butler is a Freelance Data Analyst. He was introduced to Tableau when he started his data analytics journey using free resources on Tableau Public and YouTube. He attributes his knowledge to learning the basics, downloading some data, and diving into building hands-on. Now, Elijah uses Tableau to build reports that are intuitive in helping users get answers, drive strategy, and tell stories. Elijah shares his knowledge with the community through his popular Tik Tok account and YouTube channel.
Originally having the goal of creating content about a wide range of topics, Elijah discovered soon after creating his Tik Tok account that his passion was in helping people learn data analytics, land a data job, and change their lives. With a following of almost 200k now, a lot of his content comes from either what he wishes he would have had when he got started or from questions asked in the comment section of his videos. Later, Elijah also created a YouTube channel to provide value in a long-form medium. He has released a full-length interactive course already, and recently began building out a free LinkedIn optimization course.
Connect with Elijah on Linkedin, Tableau Public, on his Tik Tok, and on his YouTube channel.
DataFam Content
- David Tanner: Getting comfortable with publishing to Tableau Public
- Ray Givler: How to Create Subject/Cohort/Population Distributions Using Relationships
- Li-Lun Tu:《Tableau 進階》90%資深Tableau玩家都會搞錯!| 美國資料視覺化設計師30分鐘帶你搞懂 FIXED LOD | Ep.43
- Tore Levinsen: TinyTableauTip Summer Guest Host Series w/ Umar Hassan
- Adam Mico: VizCritique Pro's knowledge just got a full-on knowledge upgrade and it's now baked right into GPT
- Steve Adams:
- Deepak Holla:
Visualizations
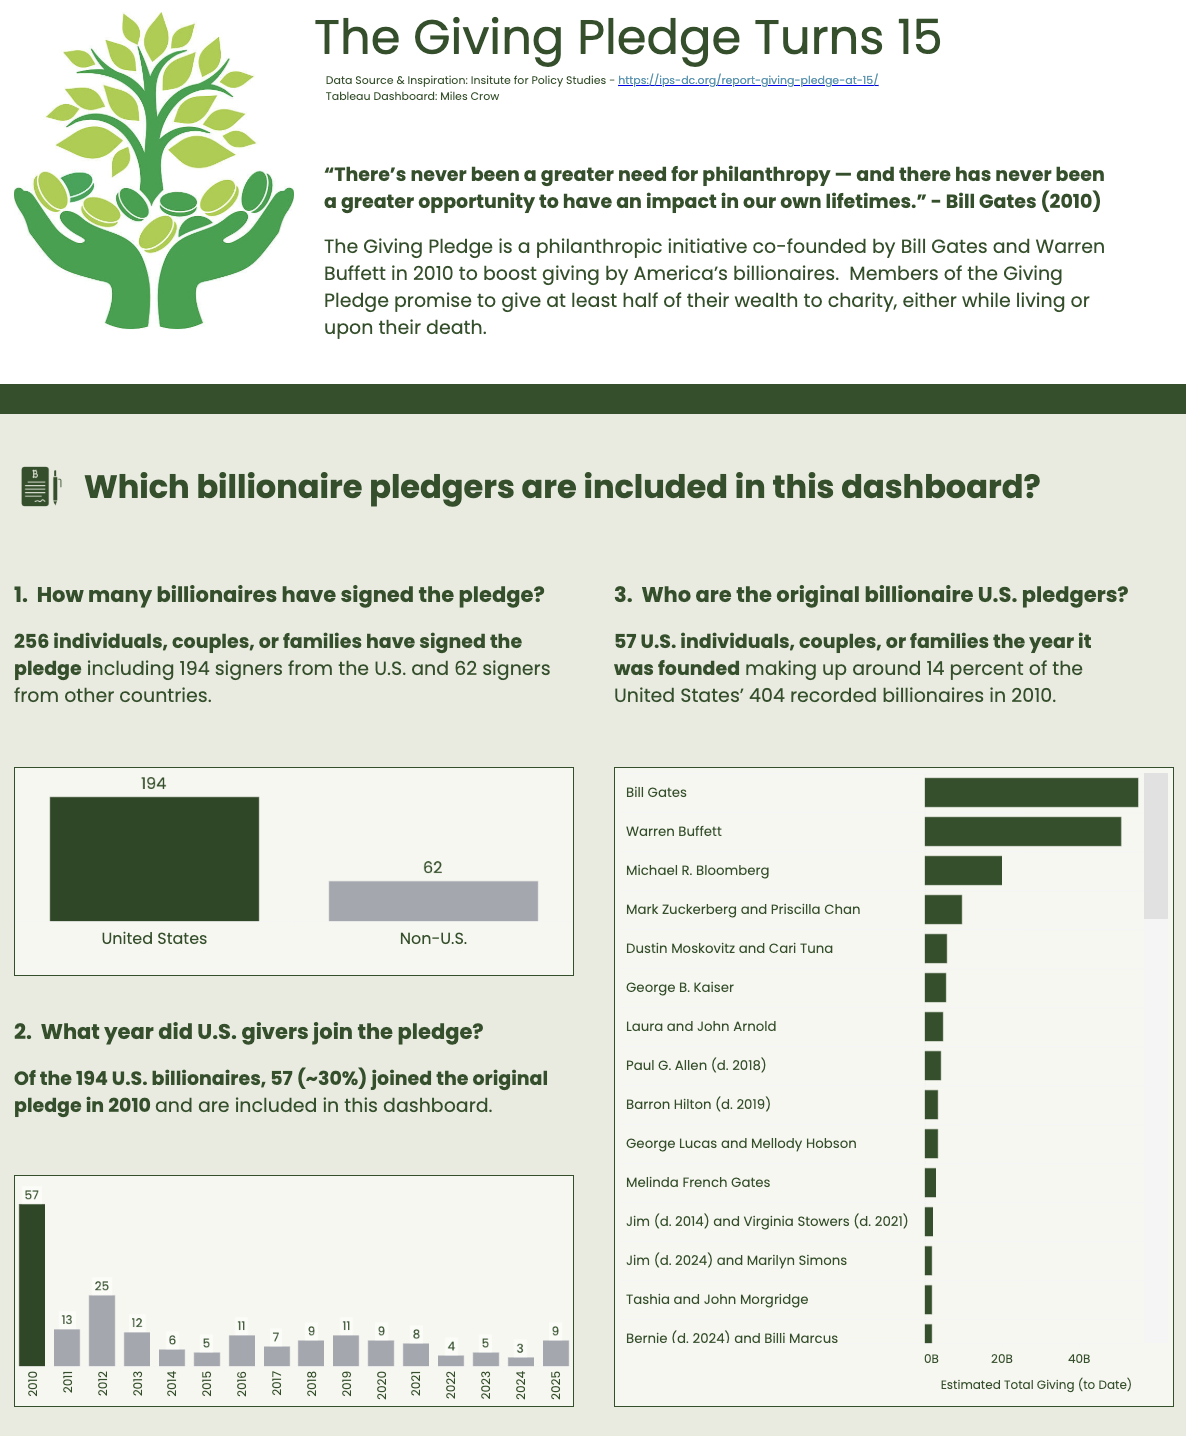
Miles Crow: Billionaire Pledge Dashboard
See the latest Viz of the Day, trending vizzes, featured authors, and more on Tableau Public.
Check out some inspirational vizzes created by the community:
- Virginia (Ginny) Moench: My Goodreads Books
- John Solomon Johansson: Viz Design Catalog Vol. IV
- Sara Fisk: The 2025 WNBA vs NBA Pay Gap
- Dennis Kao: Bhumi
Community Projects
Back 2 Viz Basics
A bi-weekly project helping those who are newer in the community and just starting out with Tableau. Not limited just to newbies!
Web: Back 2 Viz Basics
X: #B2VB
Workout Wednesday
Build your skills with a weekly challenge to re-create an interactive data visualization.
Web: Workout Wednesday
X: #WOW2022
Preppin' Data
A weekly challenge to help you learn to prepare data and use Tableau Prep.
Web: Preppin’ Data
X: #PreppinData
Makeover Monday
Create business dashboards using provided data sets for various industries and departments.
Web: Makeover Monday
X: #MakeoverMonday
Data ChangeMakers
Volunteer to design data visualizations that help nonprofits harness the power of data for social change.
Web: Data ChangeMakers
Visual Climate
Collaborate and share climate data.
Web: Visual Climate
X: #VisualClimate
DataFam Con
A monthly challenge covering pop culture and fandoms.
Web: DataFam Con
X: #DataFamCon
EduVizzers
A monthly project connecting real education data with real people.
Web: Eduvizzers
Games Night Viz
A monthly project focusing on using data from your favorite games.
Web: Games Nights Viz
X: #GamesNightViz
Iron Quest
Practice data sourcing, preparation, and visualization skills in a themed monthly challenge.
Web: Iron Quest
X: #IronQuest
Storytelling with Data
Practice data visualization and storytelling skills by participating in monthly challenges and exercises.
Web: Storytelling with Data
X: #SWDChallenge
Project Health Viz
Uncover new stories by visualizing healthcare data sets provided each month.
Web: Project Health Viz
X: #ProjectHealthViz
Diversity in Data
An initiative centered around diversity, equity & awareness by visualizing provided datasets each month.
Web: Diversity in Data
X: #DiversityinData
Sports Viz Sunday
Create and share data visualizations using rich, sports-themed data sets in a monthly challenge.
Web: Sports Viz Sunday
X: #SportsVizSunday
Real World Fake Data
Create business dashboards using provided data sets for various industries and departments.
Web: Real World Fake Data
X: #RWFD
Data Plus Music
A monthly project visualizing the data behind the music we love!
Web: Data Plus Music
X: #DataPlusMusic
BizViz52
A weekly project centered around designing business dashboards.
Web: BizViz52
X: #BizViz52
Storie correlate

DataFam Roundup June 2026

DataFam Roundup May 2026

Iron Viz 2026: Read Between the Data
 28 Maggio, 2026