Cinematic Insights: The Art of Movie Analytics


Zach Bowders, MBA is a data analyst, artist, and host of the Data+Love Podcast. View Zach’s data viz portfolio on Tableau Public—including several visualizations on movies.
When I was a kid we owned two movies, and both starred Dan Aakryod. One was a spooky supernatural comedy (that scared the heck out of me but I loved it anyway), and the other was a chaotic musical about two blues musician brothers. It was the mid ‘80s, I lived in the country, and we didn’t have cable. Those Betamax cassettes were well-loved.
Growing up in rural Pennsylvania didn’t offer a lot of opportunities to make friends, to connect, and little did I know that these movies were inducting me into a shared language. That some day one-liners like “We’re getting the band back together” and “Don’t cross the streams” would open doors to friendship and community.
But I’m getting ahead of myself, and this far in you’re asking ‘where’s the data?’, which is entirely reasonable. Stick with me.
Movies hold a unique place in culture.
Not because they’re inherently better than books or TV, but because they’re rare and difficult to make. In a time where anyone with a phone and a good idea could potentially become the next big thing, films stand out because they’re rare.
The typical film you end up seeing in theaters or at home cost tens (if not hundreds of millions of dollars), took months to years to make, and was an all-consuming effort for several hundred people. Be it a prestige drama or direct-to-streaming schlock, these things are difficult to make, and even the worst movie was someone’s passion project.
With a million streamers, more than 450 new TV shows created annually, and untold books published, film is easier to use as a cultural touchstone, because due to its relative scarcity it’s more likely that others will have seen (or at the very least heard of) a movie that you love.
My first Tableau Public viz was film-centric. I’d really fallen in love with the tool in the six months I’d been using it for work assignments, but I was curious to do more, explore other topics and methods of visualization that I wouldn’t get to try on the clock.
The viz boiled down to a particular question: did a particular director who loved twist endings make films that were well received by audiences and critics? The data wasn’t hard to find, there’s a lot of great sites like IMDb.com with that sort of data, and using Tableau I had my answer pretty quickly, and in a style and format that I wouldn’t typically have done at work. I was hooked.
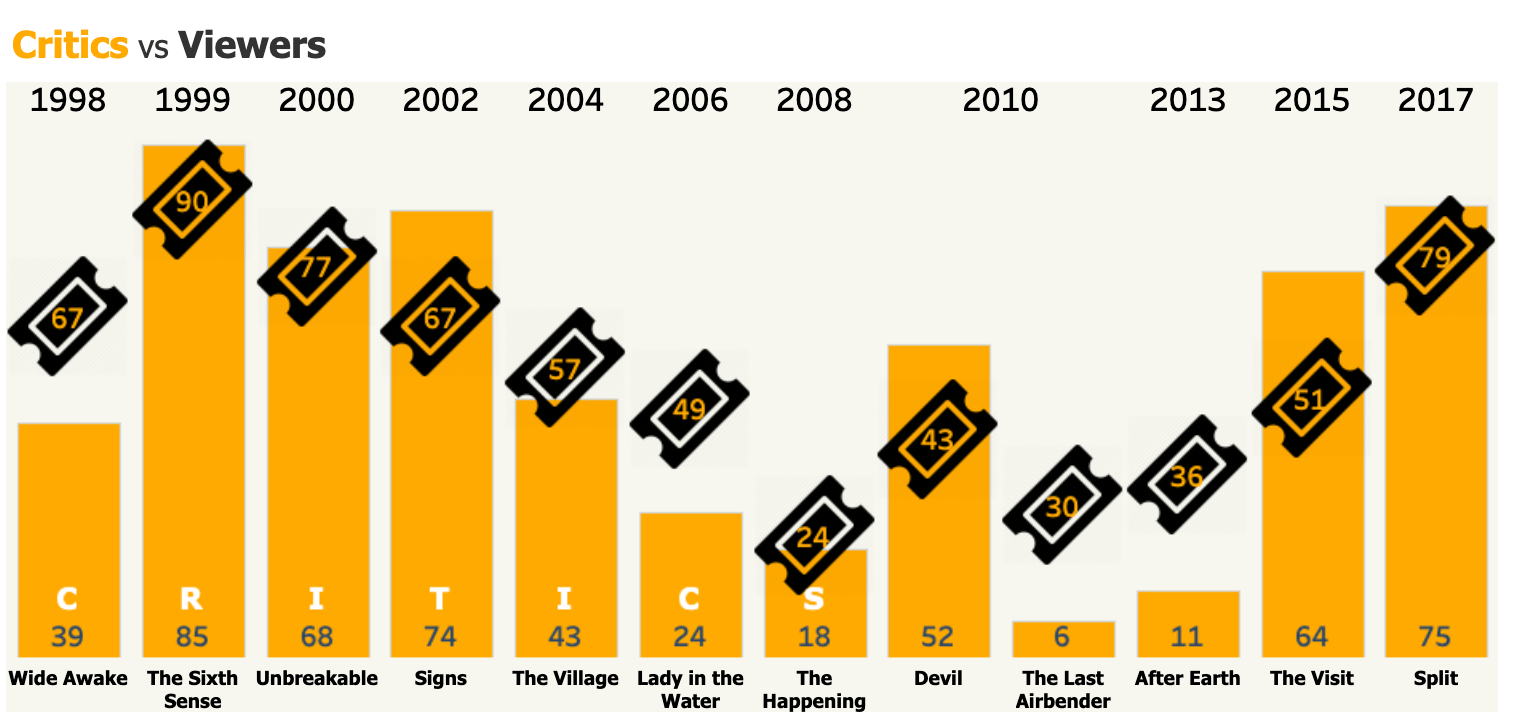
Movies are saturated with data, far beyond the obvious. On the surface you’ve got dates, reviews, box office, and budgets. This alone gives you a lot of stories you can tell. Rise and fall of franchises, most polarizing actors with critics and audiences, shifts between genres, and the rise of the blockbuster. But if you look deeper, there’s so much more that can be expressed visually—like relationships!
IMDb dataset for Tableau
When Tableau and data evangelist Andy Cotgreave reached out to me with the opportunity to play with the massive IMDb dataset he and the Tableau team assembled for Data + Movies challenge, I knew exactly what I wanted to research.
Hollywood has been known for groups of actor friend-groups who appear extensively in each other’s movies. Three prime examples are the Rat Pack, the Brat Pack, and the Frat Pack. The Rat Pack is comprised of Hollywood royalty like Frank Sinatra and Dean Martin, the Brat Pack had ‘80s teen stars like Molly Ringwald and Anthony Michael Hall (muses of director John Hughes), and the Frat Pack are the ‘00s comedy mainstays like Ben Stiller and Will Ferrell.
I used the dataset in Tableau to generate a JSON file that described the relationships between these groups of actors and their various films. I then fed this into Viz Champion Tristan Guillevin’s network tool which generated a Tableau workbook for me to further explore.
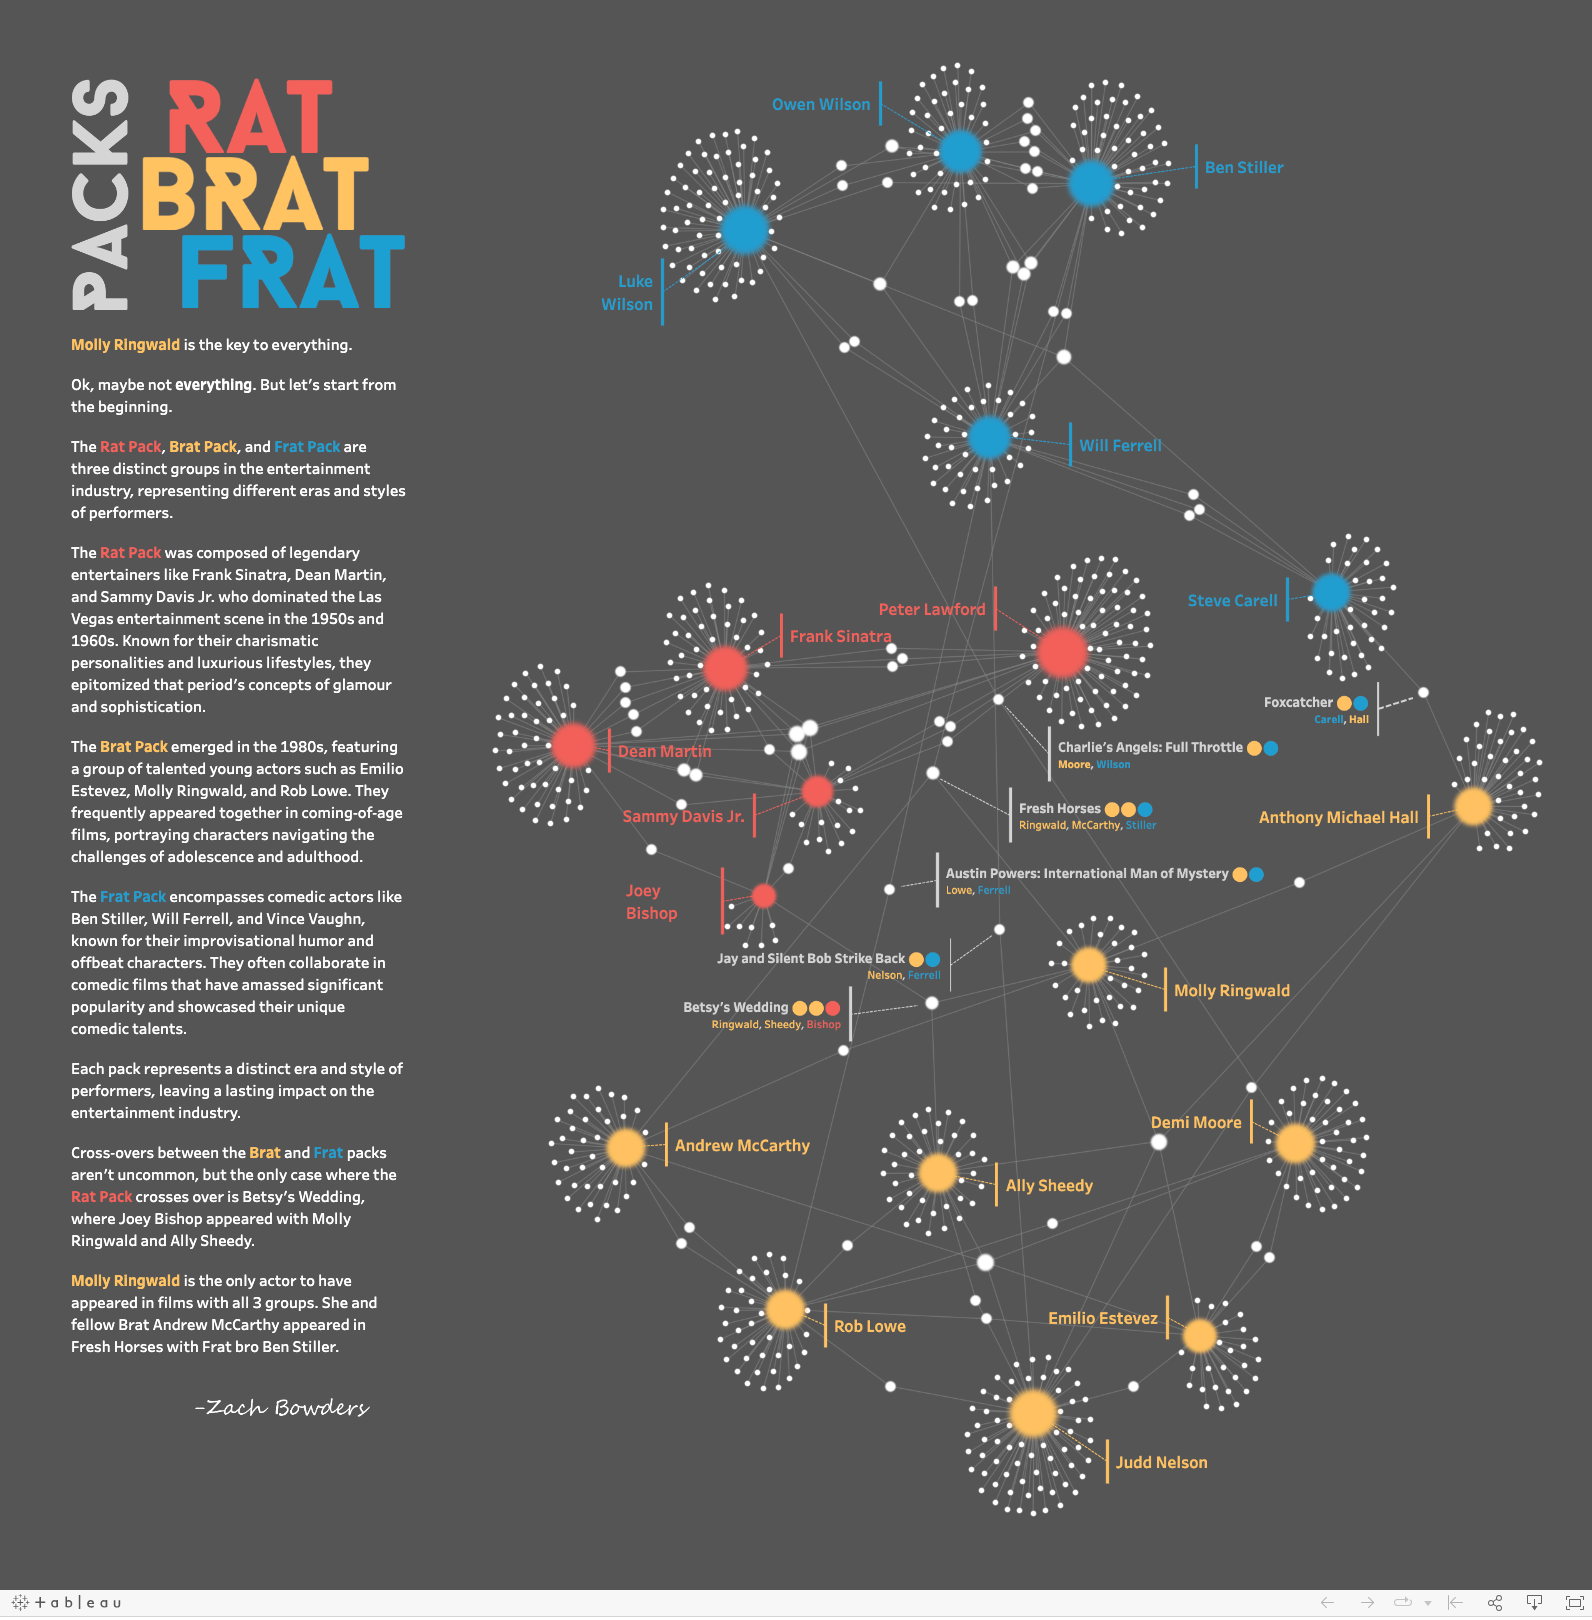
You probably aren’t surprised that Dean Martin and Sinatra appeared together very frequently, but you might be surprised to learn that it’s not as much as Owen Wilson and Ben Stiller. Did you know that Judd Nelson and Will Farrell have been in a movie together? Or Rat Packer Joey Bishop appeared with Brats Ally Sheedy and Molly Ringwald?
I do—because, to me, that’s what movies are all about—bringing people together.
Data is about making connections, bridging the gaps between the known and unknown. That’s what Tableau can do.
Grab your headphones listen as Zach talks all things data and movies on his Data+Love podcast with data evangelist Andy Cotgreave.
Storie correlate

9 Tips to Succeed in a Tableau DataDev Hackathon
 8 Gennaio, 2025

A Guide to Mapping and Geographical Analysis in Tableau
 15 Novembre, 2024

Making Tables Smarter: Key Features of the Tableau Table Viz Extension
 14 Novembre, 2024