Bringing the power of natural language to Tableau


Tableau 10 is a big update with loads of new features and capabilities. The new look and feel are immediately obvious. The power of the new data integration feature is apparent as soon as you try to use data across multiple sources. Our new developer APIs are not quite as obvious as these new features, but they enable some pretty cool product integrations that we think you’ll like!
In this post, I’m going to talk about an integration that enables something called natural language generation (NLG) which can extend the impact of your Tableau visualizations. You’ll get an overview of three awesome partners who offer this capability and build integrations for Tableau leveraging one of the new APIs, the Tableau JavaScript API called getData(), that was part of our Tableau 10 release.
Natural language generation
Natural language generation (NLG) refers to the use of advanced technology to create narratives, stories, or analyses. NLG can make data, charts, and dashboards more accessible to more people by providing textual descriptions and interpretation. NLG can also provide a faster path to insights by indicating trends to be further explored.
With solutions from the partners below, you can now add the power of NLG right alongside your Tableau visualizations and dashboards. Below is information about each offering. Please enjoy taking a look at what these NLG partners can do and get in touch with each of them directly or with us at Tableau for more information.
Automated Insights
Automated Insights is the creator of Wordsmith, the only open natural language generation (NLG) template engine. Hundreds of customers including Allstate, The Associated Press, Edmunds.com, the Orlando Magic, and Yahoo! use Wordsmith to generate more than 1.5 billion pieces of content per year, making the company the largest NLG provider in the world.
The integration of Wordsmith’s open API with Tableau’s getData() API gives users instant, automated, written explanations of Tableau visualizations that make even the most complex dashboards clear and understandable.
Customers of Tableau and Automated Insight are seeing immediate value with this new integration.
“The natural language capabilities of Wordsmith will be a fantastic addition to our dashboards,” says David Boyle, executive vice president of insight at BBC Worldwide. “It will allow us to get more people using data to make more decisions by cutting to the chase and telling people what they need to know, rather than relying on them to work it out by interpreting charts.”
Wordsmith explanations of Tableau visualizations are fully customizable and provide clear, insightful context for the data. They convey your best analysts’ expertise and insights using your company’s language. It’s like having an expert speak directly to every user, telling them what the data means.
With Wordsmith, your team’s best data experts can design a template that automatically explains what’s happening in any dashboard. Executives get a concise and digestible explanation of events while the experts move on to higher-value analysis. Using the company voice and language, Tableau users can tailor the Wordsmith template to reveal what executives care about. Tableau customers can start adding commentary to their dashboards right now with a free trial.
Narrative Science
Narrative Science is a leader in advanced natural language generation (NLG) for the enterprise. Its Quill™ platform, an intelligent system, analyzes data from disparate sources, understands what is interesting and important to the end user, and then automatically generates perfectly-written narratives for any intended audience at unlimited scale.
A diverse range of companies such as USAA, American Century Investments, MasterCard, and the US intelligence community utilize Quill to increase efficiency through the elimination of time-consuming, manual processes related to analyzing data and communicating insights, freeing employees to focus on high-value activities and better serving their customers.
Narratives for Tableau™, developed by Narrative Science, automatically explains Tableau visualizations in natural language, making it even easier for users to understand their beautiful dashboards. It’s a free, easy-to-use Chrome extension that works with Tableau Server 10 and Tableau Public, and can be installed in minutes.
The extension generates narratives that automatically uncover and communicate hidden insights in visualizations, providing real-time intelligence fueled by advanced analytics. Users can customize narratives so they highlight what matters most by specifying word choice, turning on relevant analytic packages, and sliding the verbosity scale to control how much detail is delivered. Narratives for Tableau makes it easy for users to share outputs with others using the publish function, which allows others to interact with the visualization directly and receive dynamic narratives in real-time.
Narratives for Tableau generates easy-to-read stories that highlight insights hidden in data and visualizations. These stories allow anyone to understand the visualizations, no matter how complex they are.
Yseop
Yseop is an enterprise software company that provides an artificial intelligence platform which allows customers to develop AI applications autonomously. Yseop’s Savvy product is a plug-in for Tableau that explains graphs and data in written language automatically. Save time, improve performance, and enhance capacity with Savvy for Tableau. Savvy is plug-and-play, and takes only minutes to set up. It can be installed on-premise, in the private cloud, or run on Savvy’s server. Explain the results of Tableau’s analysis automatically in language that anyone can understand.
We are excited to be working with our partners on these NLG integrations and look forward to hearing your thoughts.
getData()
Also, a bit more about this new API in Tableau 10. As you might have guessed from the name, getData() allows you to, well, get the data for a viz. Folks like Automated Insights, Narrative Science, and Yseop are able to use getData() to feed their services to create rich, descriptive stories about your data.
Other uses include exporting data to a screen reading program or creating a custom chart alongside your Tableau dashboard:
- Check out the demo video
- Check out the developer docs
- Get developer examples on GitHub
Storie correlate
Tableau and dbt Labs: Strategic Partnership and Integration
 25 Agosto, 2025

Supercharge Analytics with the Power of AWS-Hosted TabPy
 14 Ottobre, 2024
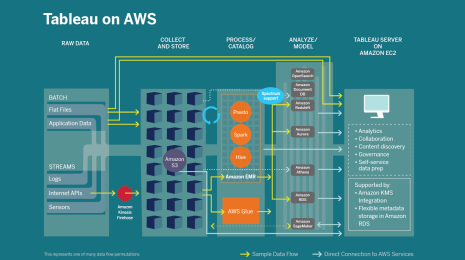
Tableau + AWS: Accelerating your digital transformation with Modern Cloud Analytics
 27 Novembre, 2023
Tableau and AWS help customers digitally transform with Modern Cloud Analytics, combining technical resources and expertise with our vast partner networks.