Behind Millennials and Data: Chantilly Jaggernauth


Black History Month originated to celebrate and recognize the achievements of African Americans. The Tableau team is committed to helping our community by educating and providing the necessary tools that help leverage data and data visualizations to inspire anyone to effectively and ethically use data to advocate for change and end inequalities. We are proud to see that people from the DataFam are also contributing to accomplishing this.
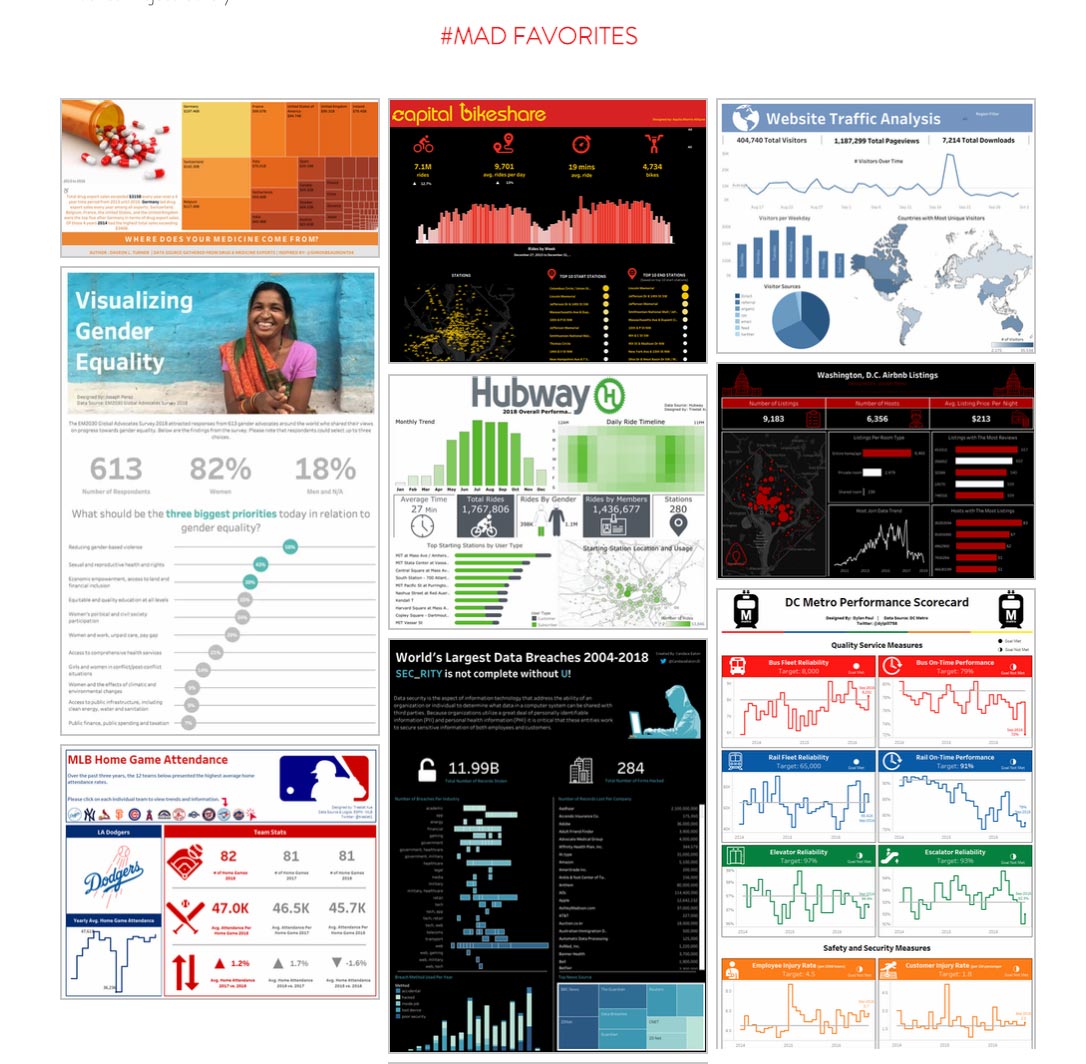
Meet Chantilly Jaggernauth! Vice President of Data Visualization & Training at Lovelytics and one of our Tableau Zen Masters, member of our Equity Task Force and Tableau Public Ambassador who also founded Millennials and Data (#MAD). Her mission is to empower corporations and individuals through the use of data visualizations and data analytics. Through #MAD, she works to connect the data literacy and analytical skills gap by training, mentoring, and preparing millennials to enter a data-driven global environment. Take a look at her data story:

How was #MAD created? What inspired you to?
I’ve always had a passion for teaching and once upon a time I wanted to be a professor.
Suddenly I was asked to offer a free lecture to Howard University students and there was the opportunity. Instead of me giving a free lecture, I built a program for these students that did not have a data analytics curriculum. I wanted to teach and train in Tableau and data to make sure participants were provided the necessary skills for a global data environment and somehow also give back to my community and University.
Biggest accomplishment with #MAD?
#MAD started as a local program for students at Howard University and now it is a global one. Within 2 years of having founded #MAD and until last December, 50 students have graduated from our program. We are looking forward to having a total of 100 students graduated for 2021.
Any advice for someone new to Tableau and the data world?
Learn the basics of data and relate that to Tableau. People get confused and oftentimes want to learn the tool without knowing the basics but I can assure you that if you learn data literacy first, you will learn how to use the tool quicker.
A way of honoring Black History Month through data?
For me it’s more than just a month. One of the reasons I started #MAD was to introduce Black students into the community and it is a way of providing them the opportunities they would most likely don’t have and whenever I have the chance, I promote my students.
Black History Month might be almost over but we encourage you to keep participating all year long and make sure you are following all of this month’s Featured Authors — who are recent graduates from the Millennials and Data Analyst Boot Camp!
Storie correlate

Iron Viz 2026: Read Between the Data
 28 Maggio, 2026

Tableau's Iron Viz Winners

Explore the 2026 Iron Viz Entries
 15 Dicembre, 2025