DataFam Roundup July 21-25, 2025


Welcome! Dig into this week's DataFam Roundup—a weekly blog that brings together community content all in one post. As always, we invite you to send us your content—and the DataFam content from your peers that have inspired you! Find the content submission form here.
Community Highlight
To recognize new and consistent Tableau contributors—we’re excited to have a section within the weekly DataFam Roundup called the Tableau Community Highlight. Find out how to get involved.

Phyllis Tay, Data Analytics Manager
Singapore
Phyllis Tay is a Data Analytics Manager. Her journey with Tableau began when she attended a workshop, quickly realizing its potential as a "game changer" for descriptive analysis. She primarily learned through Tableau's free online videos, supplementing her knowledge with blogs and the Tableau Forums when encountering challenges. Phyllis continued to develop her skills by participating in data visualization competitions, including placement in the top 15 in Iron Viz 2023 and competing in Singapore's public service data visualization events.
Now highly involved in the Tableau Community, Phyllis is a co-lead of the Singapore Tableau User Group. This involvement is driven by the strong friendships formed with her fellow co-leads and the strong community they've cultivated within the Singapore DataFam. Phyllis’s inspiration for Tableau Public vizzes comes from many different sources, including tips from Tableau Conferences and "Viz of the Day" vizzes. Beyond the Singapore Tableau User Group, Phyllis has shared her expertise by presenting on topics like building recommenders using Tableau and having her vizzes featured in the Viz Gallery at Tableau Conference.
Connect with Phyllis on Linkedin and Tableau Public.
DataFam Content
- Tharashasank Davuluru: Query Optimizations in Power BI and Tableau: Boosting Performance the Smart Way
-
Tore Levinsen: TinyTableauTip – Guest Host Sam Batchelor
- Ojoswi Basu: Tableau Resources List
- Steve Adams: Be the Dashboard Detective
- Deepak Holla:
Team Tableau Content
- Tableau 2025.2 is Now Available
- 2025 Tableau Ambassador Nominations and Applications Close July 25 at 11:59pm PT
Visualizations
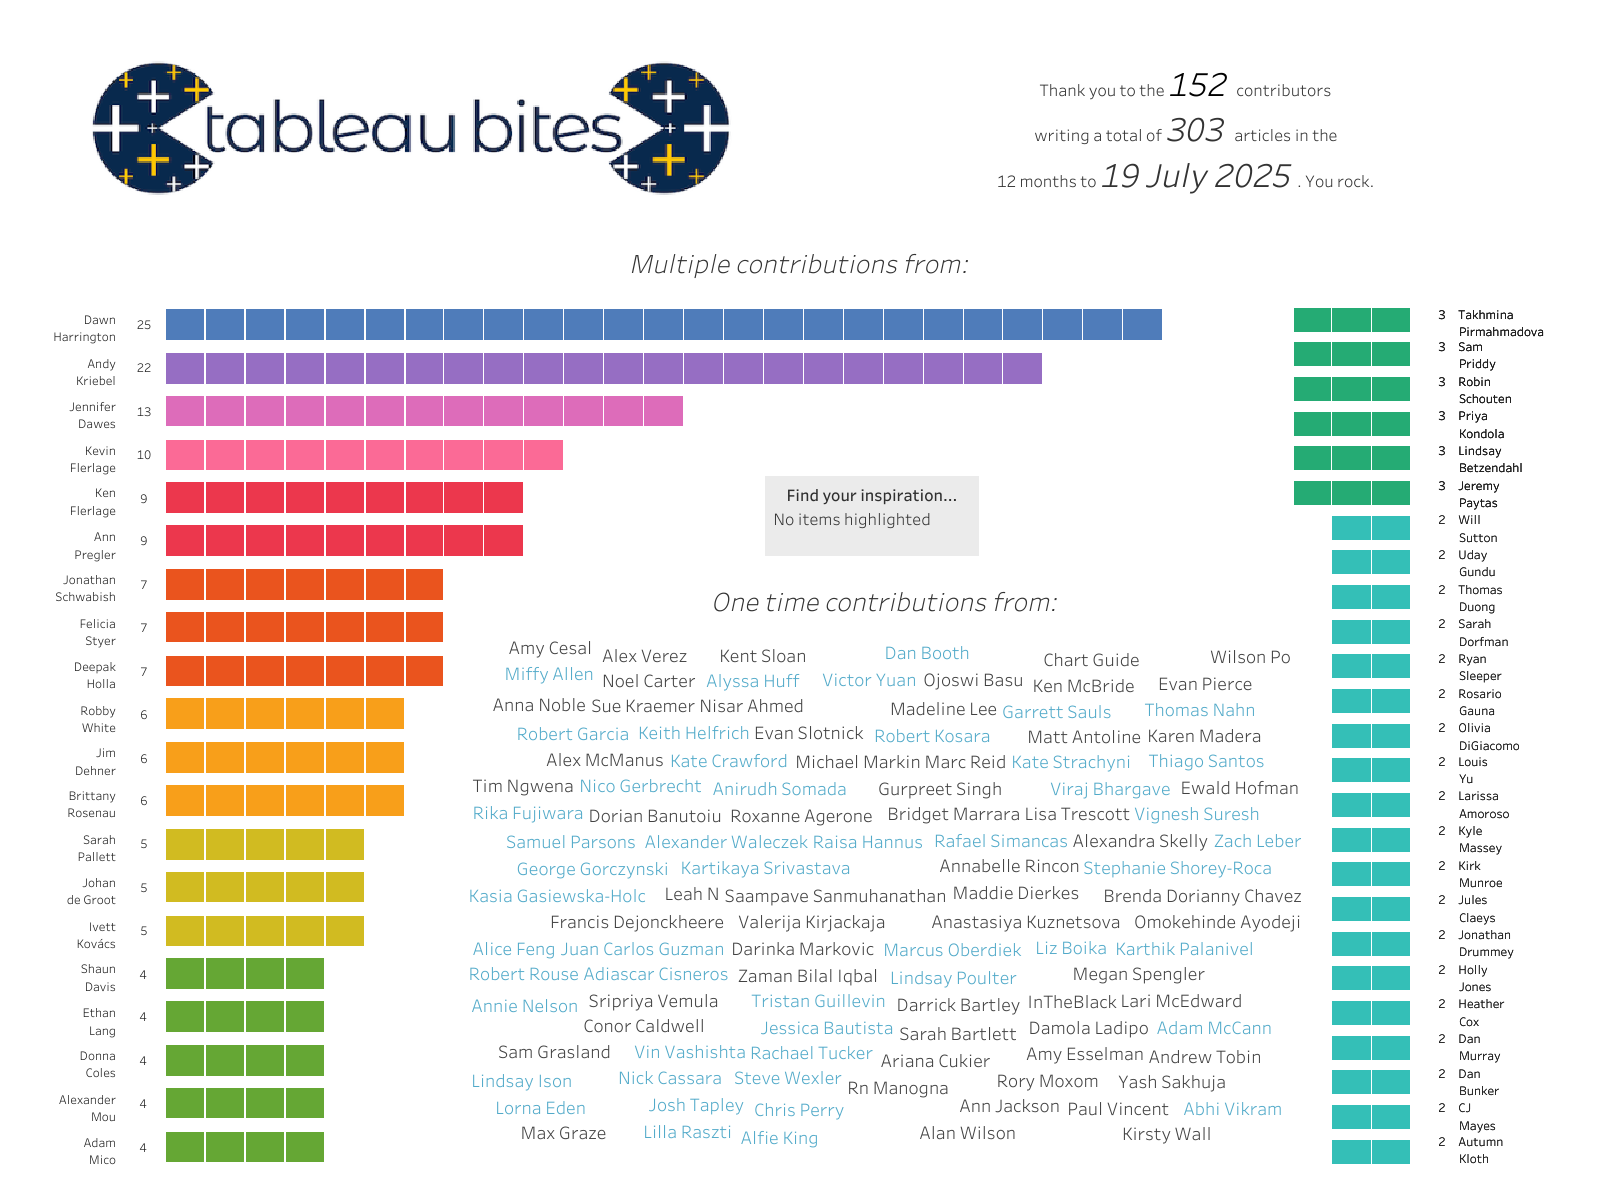
Steve Adams: Tableau Bites | Featured Authors and their Blogs
See the latest Viz of the Day, trending vizzes, featured authors, and more on Tableau Public.
Check out some inspirational vizzes created by the community:
-
John Johansson: Viz Design Catalog Vol.III
-
Freya Marijatta: Nutritional Information for Starbucks Matcha Drinks
- Michael McCusker: Coffee Chain Analysis - Parameter Actions (w/ Multi-Select Parameters)
- Muhammad Muhthadi Choudhury: The Elements of Perfumery
Community Projects
Back 2 Viz Basics
A bi-weekly project helping those who are newer in the community and just starting out with Tableau. Not limited just to newbies!
Web: Back 2 Viz Basics
X: #B2VB
Workout Wednesday
Build your skills with a weekly challenge to re-create an interactive data visualization.
Web: Workout Wednesday
X: #WOW2022
Preppin' Data
A weekly challenge to help you learn to prepare data and use Tableau Prep.
Web: Preppin’ Data
X: #PreppinData
Makeover Monday
Create business dashboards using provided data sets for various industries and departments.
Web: Makeover Monday
X: #MakeoverMonday
Data ChangeMakers
Volunteer to design data visualizations that help nonprofits harness the power of data for social change.
Web: Data ChangeMakers
Visual Climate
Collaborate and share climate data.
Web: Visual Climate
X: #VisualClimate
DataFam Con
A monthly challenge covering pop culture and fandoms.
Web: DataFam Con
X: #DataFamCon
EduVizzers
A monthly project connecting real education data with real people.
Web: Eduvizzers
Games Night Viz
A monthly project focusing on using data from your favorite games.
Web: Games Nights Viz
X: #GamesNightViz
Iron Quest
Practice data sourcing, preparation, and visualization skills in a themed monthly challenge.
Web: Iron Quest
X: #IronQuest
Storytelling with Data
Practice data visualization and storytelling skills by participating in monthly challenges and exercises.
Web: Storytelling with Data
X: #SWDChallenge
Project Health Viz
Uncover new stories by visualizing healthcare data sets provided each month.
Web: Project Health Viz
X: #ProjectHealthViz
Diversity in Data
An initiative centered around diversity, equity & awareness by visualizing provided datasets each month.
Web: Diversity in Data
X: #DiversityinData
Sports Viz Sunday
Create and share data visualizations using rich, sports-themed data sets in a monthly challenge.
Web: Sports Viz Sunday
X: #SportsVizSunday
Real World Fake Data
Create business dashboards using provided data sets for various industries and departments.
Web: Real World Fake Data
X: #RWFD
Data Plus Music
A monthly project visualizing the data behind the music we love!
Web: Data Plus Music
X: #DataPlusMusic
BizViz52
A weekly project centered around designing business dashboards.
Web: BizViz52
X: #BizViz52
Articles sur des sujets connexes

DataFam Roundup June 2026

DataFam Roundup May 2026

Iron Viz 2026: Read Between the Data
 mai 28, 2026