DataFam Roundup June 2026


Welcome! Dig into this month’s DataFam Roundup—a monthly blog that brings together community content all in one post. As always, we invite you to send us your content—and the DataFam content from your peers that have inspired you! Join the Tableau Community workspace on Slack and join the #community-share channel to get your daily inspiration, tips, tricks from the DataFam!
Community Highlight
To recognize new and consistent Tableau contributors—we’re excited to have a section within the monthly DataFam Roundup called the Tableau Community Highlight. Find out how to get involved.

Anweasha Saha, Data Analyst
California, USA
Anweasha Saha is a Data Analyst. She first dove into Tableau during the pandemic and the platform is both a daily workplace essential and a vibrant creative outlet for her. What began as a tool for crafting intuitive business dashboards during an on-campus role quickly evolved into a passion project through Tableau Public. Fueled by a mix of YouTube tutorials, blogs from The Information Lab, and a healthy dose of curiosity, Anweasha mastered the art of reverse-engineering dashboards to learn complex designs. Today, she uses LinkedIn to share not just her finished vizzes, but the raw experimentation and discoveries behind them, hoping to inspire fellow data enthusiasts to step outside their comfort zones and try something new.
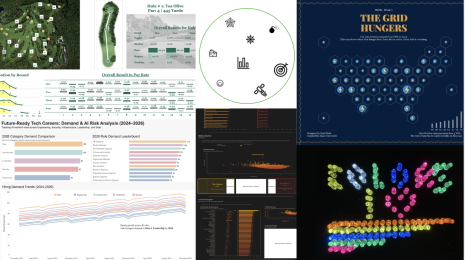
Anweasha’s creative drive is beautifully showcased in her recent "Adult LGBTQ+ Population in the US" dashboard, a Pride Month celebration inspired by a unique rainbow arc chart she challenged herself to recreate. Combining data from The Williams Institute with gradient arcs and a hex tile map, the project reflects her love for marrying storytelling with beautiful visuals. Looking ahead, Anweasha is excited to reconnect with community initiatives like Makeover Monday and Back to Viz Basics, and she even plans to tackle some past dashboards that once felt too complex. Guided by the supportive and welcoming energy of the DataFam, she continues to push the boundaries of what standard data visualization can be.
Connect with Anweasha on LinkedIn and Tableau Public.
DataFam Content
Blogs
- Ann Jackson: The State of Analytics, as Told by the 2026 Tableau Conference
- Celia Fryar:
- Deepak Holla: Basic Data Cleaning Steps in Tableau Desktop: Turning Messy Data into Reliable Insights
- Favour Okoli: The Universal Translators of the Digital World
- Jacob Rothemund: Passing Parameters via URL in Tableau – A Subtle Gotcha
- Rob Taylor: Tableau Map Layers: How 2020.4 Changed Everything
Videos
Visualizations
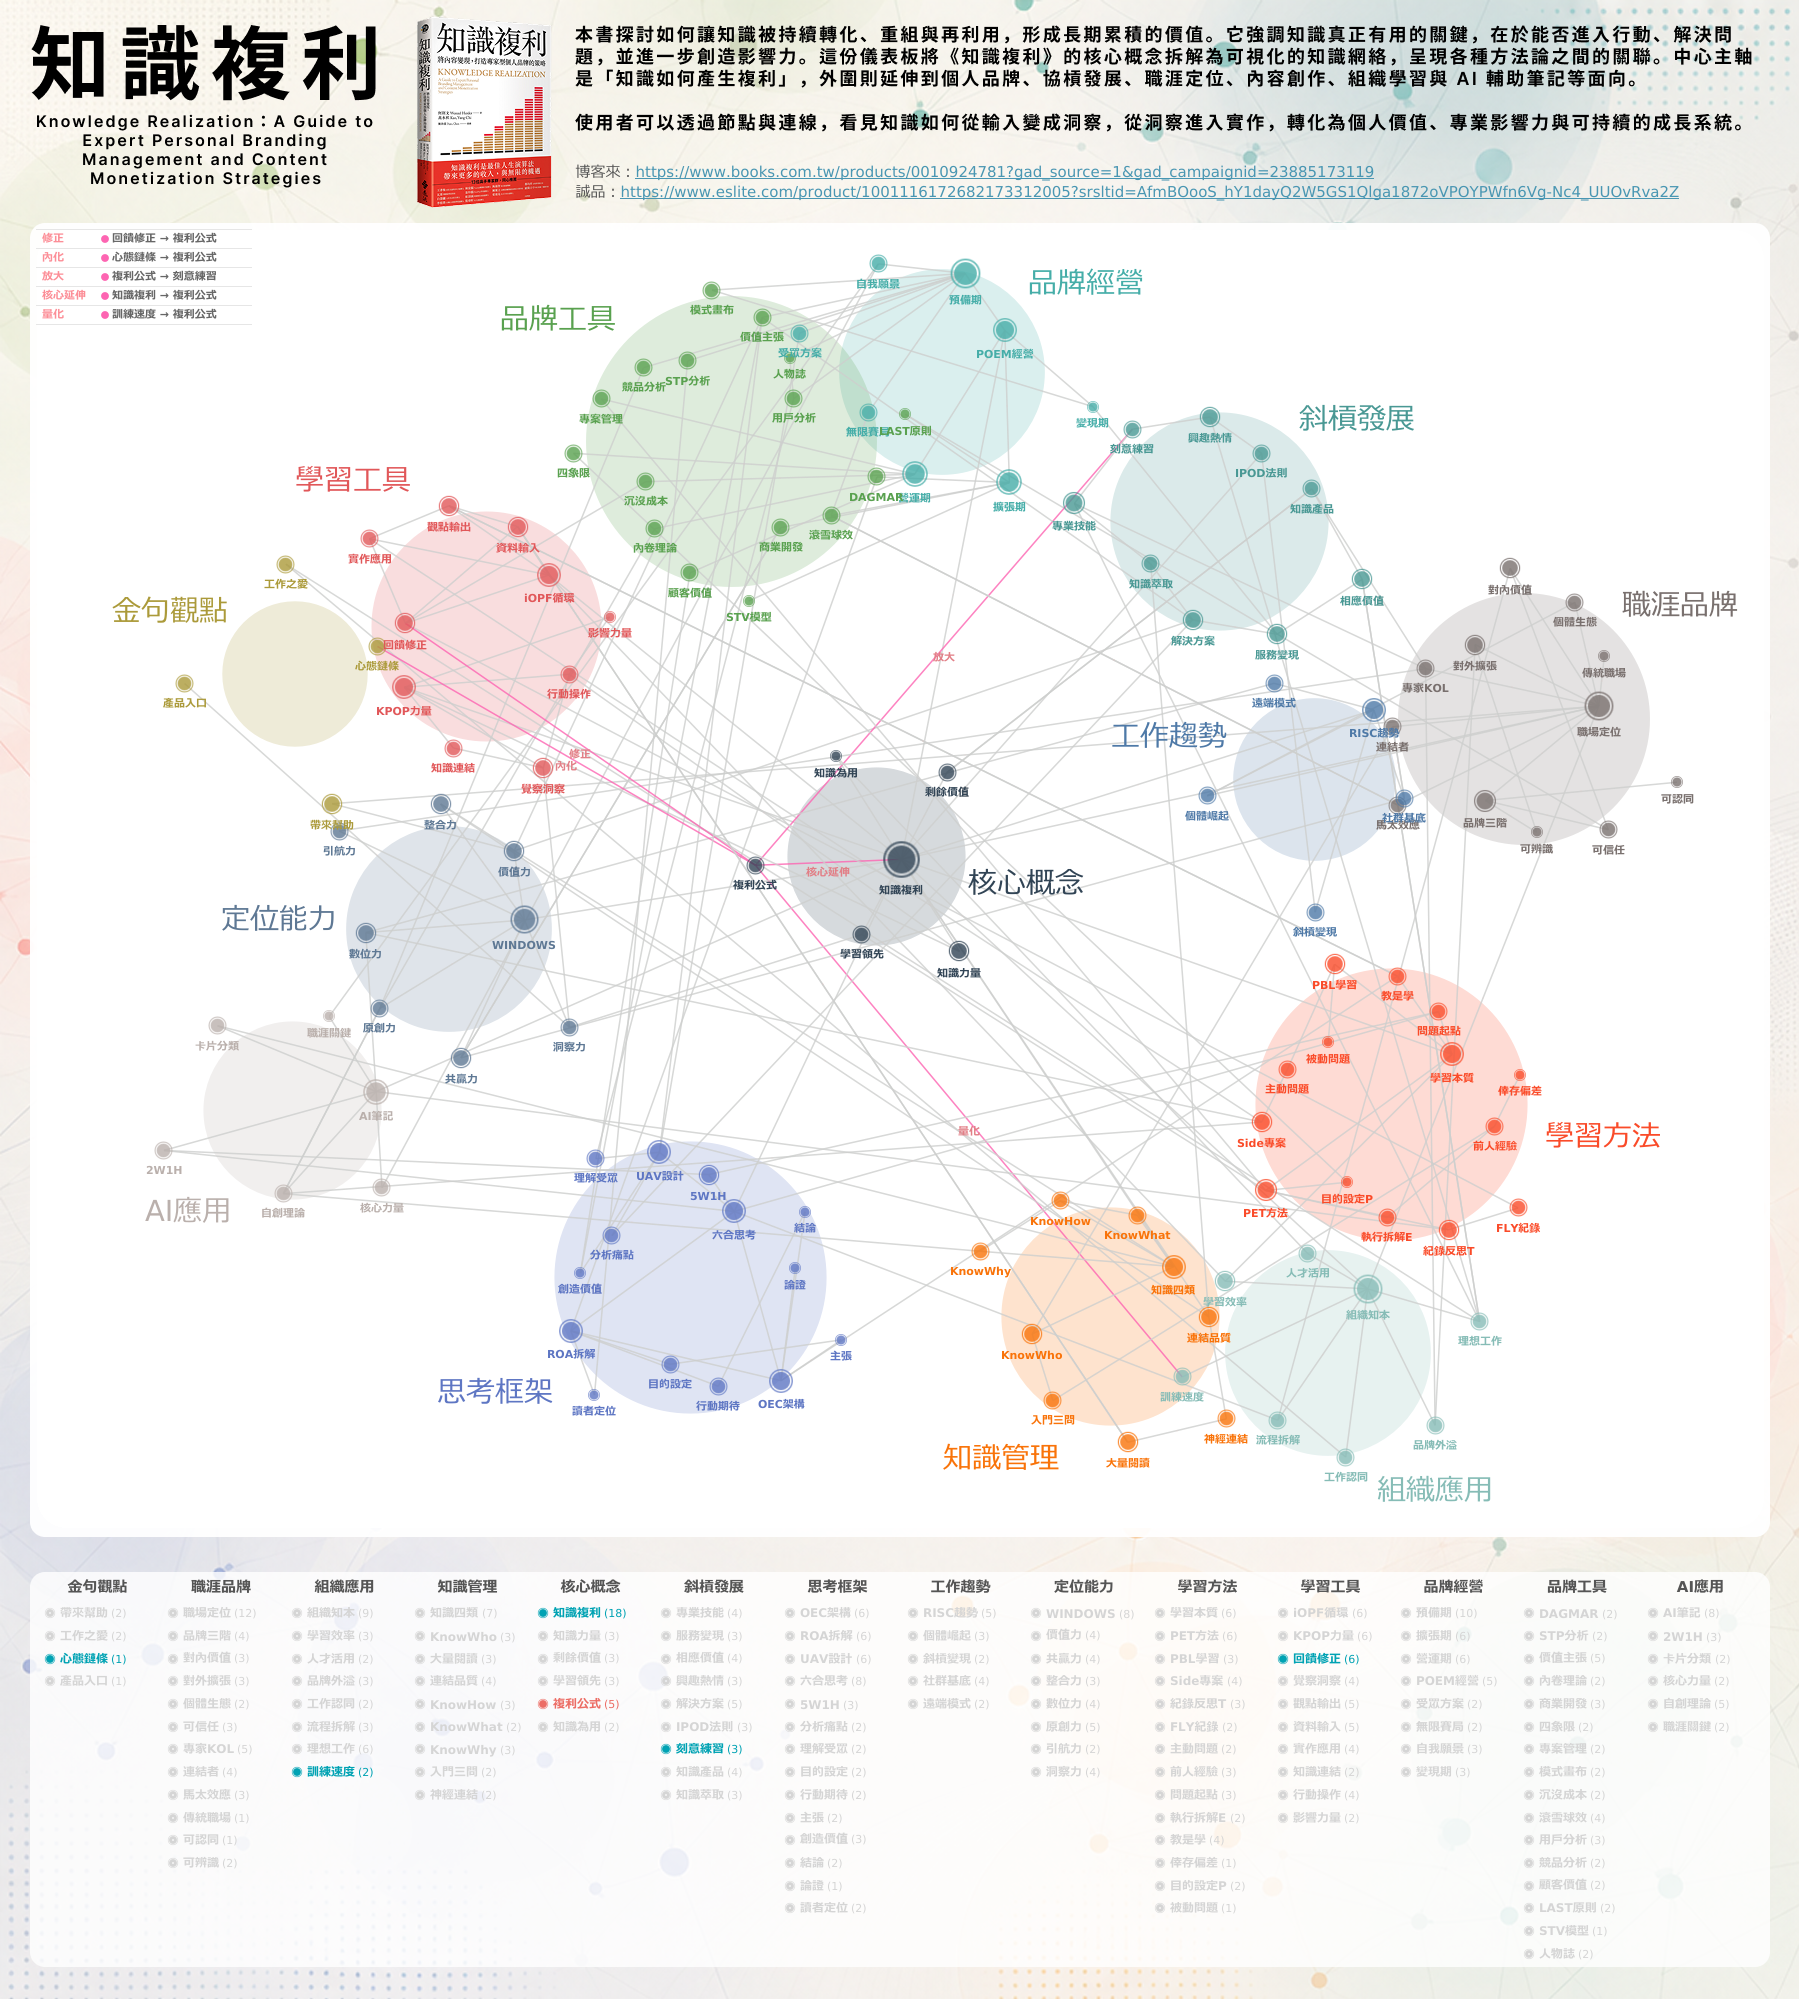
Bill Chen:《Knowledge Realization》Network Map
See the latest Viz of the Day, trending vizzes, featured authors, and more on Tableau Public.
Check out some inspirational vizzes created by the community:
- Whitney Wood: Why the Years Fly By As We Age
- Jeremy Johnson: Sea Turtle Sightings
- Atahan Fırıncılar:
- Zyad Wael: Oscar Awards - B2VB 2026 Week 6
- Bill Chen: 《Knowledge Realization》Network Map
- Jeremy Johnson: Timeline of Same Sex Marriage
- Deepak Holla: The Hidden Cost of Convenience Everyday Choices That Cost More Than You Think
- Rob Taylor: FIFA World Cup 2026 | The Circle Of Champions
- Matt Meier:
Social Posts and Other Content
- Deepak Holla:
Job Board
Check out the #job-board channel in the Community Slack Workspace for the latest available jobs in the data space. Find the 5 most recent listings below.
- [Full-Time; Atlanta, GA (Hybrid)] Business Intelligence Analyst at Spelman College
- [Full-Time; Waterloo or Toronto, Ontario] Senior Data Analyst at Sun Life
- [Full-Time; Denver, CO] Data Analyst at Denver Summit FC
- [Contract; Remote] Tableau Consultant at XeoMatrix
- [Full-Time; West Des Moines, IA] Senior Process Analyst at athene
Team Tableau Content
- Tableau 2026.2 Release is here!
- Upcoming Webinar on July 1: Deliver Insights in the Flow of Work Across Any App with Headless Analytics
- Webinar: Unlock Agentic Analytics on Tableau Server with Full Control and Flexibility
- DataDev AMA: Mastering the Model Context Protocol
Community Projects
Back 2 Viz Basics
A bi-weekly project helping those who are newer in the community and just starting out with Tableau. Not limited just to newbies!
Web: Back 2 Viz Basics
X: #B2VB
Workout Wednesday
Build your skills with a weekly challenge to re-create an interactive data visualization.
Web: Workout Wednesday
X: #WOW2022
Preppin' Data
A weekly challenge to help you learn to prepare data and use Tableau Prep.
Web: Preppin’ Data
X: #PreppinData
Makeover Monday
Create business dashboards using provided data sets for various industries and departments.
Web: Makeover Monday
X: #MakeoverMonday
Data ChangeMakers
Volunteer to design data visualizations that help nonprofits harness the power of data for social change.
Web: Data ChangeMakers
Visual Climate
Collaborate and share climate data.
Web: Visual Climate
X: #VisualClimate
DataFam Con
A monthly challenge covering pop culture and fandoms.
Web: DataFam Con
X: #DataFamCon
EduVizzers
A monthly project connecting real education data with real people.
Web: Eduvizzers
Games Night Viz
A monthly project focusing on using data from your favorite games.
Web: Games Nights Viz
X: #GamesNightViz
Iron Quest
Practice data sourcing, preparation, and visualization skills in a themed monthly challenge.
Web: Iron Quest
X: #IronQuest
Storytelling with Data
Practice data visualization and storytelling skills by participating in monthly challenges and exercises.
Web: Storytelling with Data
X: #SWDChallenge
Project Health Viz
Uncover new stories by visualizing healthcare data sets provided each month.
Web: Project Health Viz
X: #ProjectHealthViz
Diversity in Data
An initiative centered around diversity, equity & awareness by visualizing provided datasets each month.
Web: Diversity in Data
X: #DiversityinData
Sports Viz Sunday
Create and share data visualizations using rich, sports-themed data sets in a monthly challenge.
Web: Sports Viz Sunday
X: #SportsVizSunday
Real World Fake Data
Create business dashboards using provided data sets for various industries and departments.
Web: Real World Fake Data
X: #RWFD
Data Plus Music
A monthly project visualizing the data behind the music we love!
Web: Data Plus Music
X: #DataPlusMusic
BizViz52
A weekly project centered around designing business dashboards.
Web: BizViz52
X: #BizViz52
Articles sur des sujets connexes

DataFam Roundup May 2026

Iron Viz 2026: Read Between the Data
 mai 28, 2026