DataFam Roundup April 2026


Welcome! Dig into this month's DataFam Roundup—a monthly blog that brings together community content all in one post. As always, we invite you to send us your content—and the DataFam content from your peers that have inspired you! To send us your content, join the Tableau Community workspace on Slack and join the #community-share channel.
Community Highlight
To recognize new and consistent Tableau contributors—we’re excited to have a section within the monthly DataFam Roundup called the Tableau Community Highlight. Find out how to get involved.

Nicole Baratta, Principal Business Value & Measurement Program Manager, Unified Intelligence Engineering, Red Hat and Austin Tableau User Group Organizer
Texas, USA
Nicole Baratta is the Principal Business Value & Measurement Program Manager for Unified Intelligence Engineering at Red Hat, where she translates complex AI initiatives into tangible business value. Nicole is a self-described data enthusiast who finds as much joy in the "perfect clean" of Tableau Prep as she does in the final visualization. Her journey with Tableau began with a curiosity-driven online course and a passion for social impact, leading to her first project mapping student demographics for ChickTech. Today, she continues to push the boundaries of data science at work, recently completing a course in dbt and Snowflake to further integrate advanced data engineering with impactful Tableau visualizations. Outside of work, Nicole stays active in the Tableau community by serving as a leader of the Austin Tableau User Group.
Driven by a lifelong passion for sharing knowledge, ranging from her early days as a technology blogger to her current role as a mentor, Nicole has established multiple internal communities of practice at Red Hat to foster a culture of data literacy. Whether she is posting insights on LinkedIn, answering questions in the Community Forums, or organizing local events, Nicole’s focus remains on fostering a spirit of support. For Nicole, the heart of the Tableau ecosystem is the people, and she thrives on creating spaces where fellow data enthusiasts can connect, learn, and innovate.
Connect with Nicole on Linkedin and Tableau Public.
DataFam Content
Events
Catch these Tableau Community Leaders speaking at the Next Level Tableau Live Virtual Conference and then keep the learning going by checking out their Tableau Conference sessions in San Diego or on Salesforce+.
Blogs
- Deepak Holla: The Hidden UI Feature in Tableau Desktop: True Modeless Dialog Boxes Explained
- Eric Parker: How Specific Dimensions Works in Tableau Table Calculations
- Fi Crocker and Sarah Burnett: TC Tips to Get the Most from Conference
- Fi Crocker, Sarah Burnett, Sarah Pallett, Celia Fryar, Sam Batchelor Sudhaa Ramakrishnan: Getting the Most Out of TC - Part 1
- Luigi Cicciari: How I Approach Tableau Conference
- Oliver Linley: How to Build Arrow Charts in Tableau
- Pat Sarsfield: Create a “Clean” Tableau Data Source AFTER you’ve built a Dashboard
- Rida Hamid: My Learning Journey to Pass the Tableau Exam, Salesforce Certified Tableau Foundation
- Suddhasheel Bhattacharya: I Built a Tableau Dashboard with an AI Agent. Here’s Every Step That Actually Happened.
- Andy Holt:
Videos
- Eric Parker:
Social Posts and Other Content
- Valerie Madojemu: Tableau MCP Cheatsheet
- Rod Sardari, PhD: Paths to Update your Content with the Latest American Community Survey (ACS) Layers
- Deepak Holla:
Job Board
Check out the #job-board channel in the Community Slack Workspace for the latest available jobs in the data space. Find the 5 most recent listings below.
- [Full-Time; Remote] Sr Data & Analytics Consultant at Principal Financial
- [Part-Time; Chicago, IL] Intern, Hockey Analytics at Chicago Blackhawks
- [Contract; Reston VA] Contract - Operations Systems Analyst at Electrify America
- [Full-Time; Ireland] Senior Strategy & Planning Analyst at Grafana Labs
- [Full-Time; Minneapolis, MN] Analyst, Customer Marketing Analytics at L’Oréal
Team Tableau Content
- An Exclusive Tableau Conference Preview
- Register for Tableau Conference 2026!
- Join the Tableau Conference 2026 Hackathon
- Tableau April 2026 Release
- Tableau Research Which Model Speaks Your Data Language? A User-Centered Approach to Evaluating LLMs for Conversational Visual Analytics
Visualizations
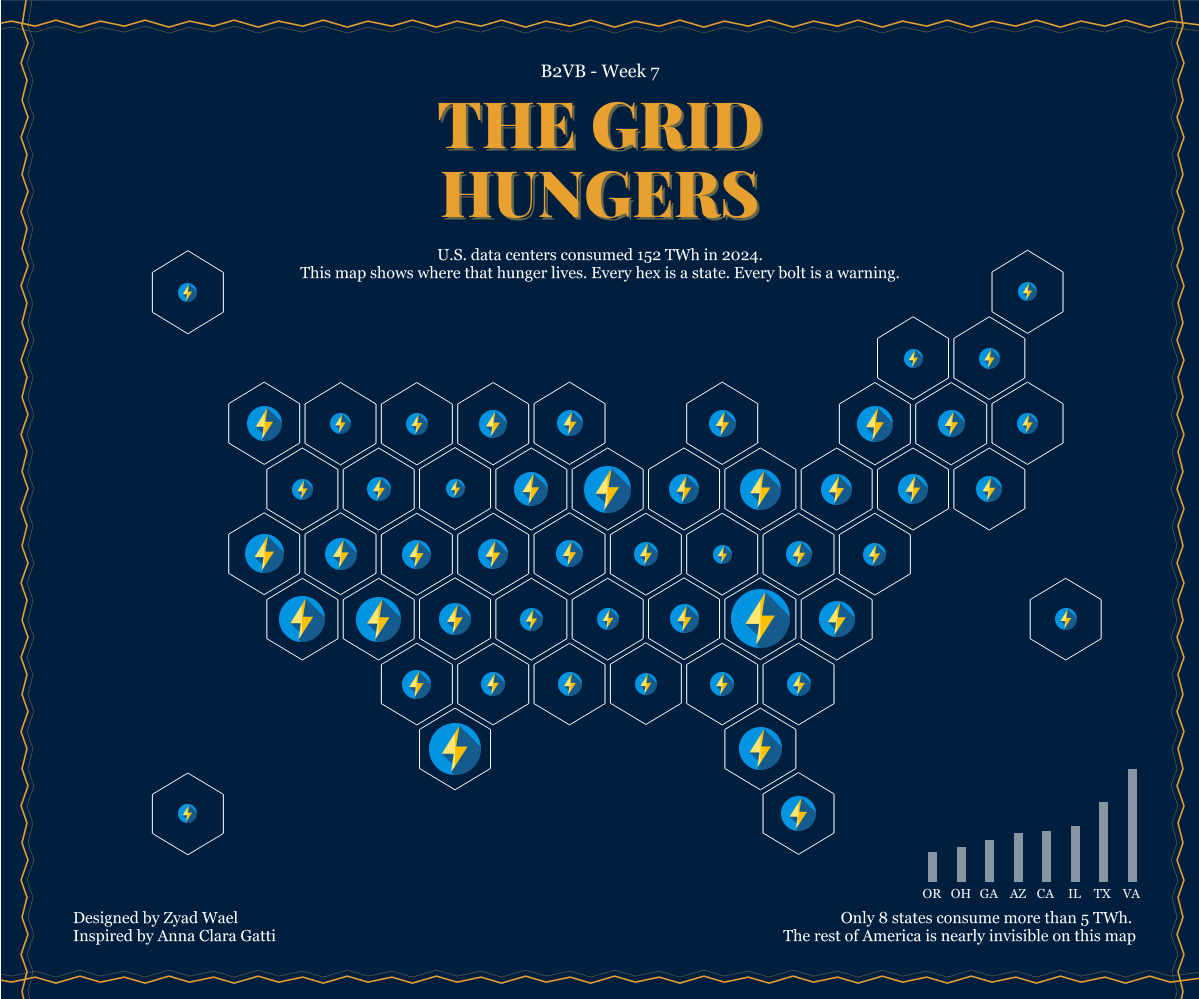
Zyad Wael: US Power Consumption - B2VB Week 7
See the latest Viz of the Day, trending vizzes, featured authors, and more on Tableau Public.
Check out some inspirational vizzes created by the community:
- Andy Holt: The Marmite of the Movies
- Dan Chissick: Dobble
- Deepak Holla: Future-Ready Tech Careers Demand & AI Risk Analysis (2024–2026)
- Jan Giger: Colors I love
- Matthias Giger: Hello From The Other Side
- Rafael Guevara Jr: The 2025 Masters Tournament
Community Projects
Back 2 Viz Basics
A bi-weekly project helping those who are newer in the community and just starting out with Tableau. Not limited just to newbies!
Web: Back 2 Viz Basics
X: #B2VB
Workout Wednesday
Build your skills with a weekly challenge to re-create an interactive data visualization.
Web: Workout Wednesday
X: #WOW2022
Preppin' Data
A weekly challenge to help you learn to prepare data and use Tableau Prep.
Web: Preppin’ Data
X: #PreppinData
Makeover Monday
Create business dashboards using provided data sets for various industries and departments.
Web: Makeover Monday
X: #MakeoverMonday
Data ChangeMakers
Volunteer to design data visualizations that help nonprofits harness the power of data for social change.
Web: Data ChangeMakers
Visual Climate
Collaborate and share climate data.
Web: Visual Climate
X: #VisualClimate
DataFam Con
A monthly challenge covering pop culture and fandoms.
Web: DataFam Con
X: #DataFamCon
EduVizzers
A monthly project connecting real education data with real people.
Web: Eduvizzers
Games Night Viz
A monthly project focusing on using data from your favorite games.
Web: Games Nights Viz
X: #GamesNightViz
Iron Quest
Practice data sourcing, preparation, and visualization skills in a themed monthly challenge.
Web: Iron Quest
X: #IronQuest
Storytelling with Data
Practice data visualization and storytelling skills by participating in monthly challenges and exercises.
Web: Storytelling with Data
X: #SWDChallenge
Project Health Viz
Uncover new stories by visualizing healthcare data sets provided each month.
Web: Project Health Viz
X: #ProjectHealthViz
Diversity in Data
An initiative centered around diversity, equity & awareness by visualizing provided datasets each month.
Web: Diversity in Data
X: #DiversityinData
Sports Viz Sunday
Create and share data visualizations using rich, sports-themed data sets in a monthly challenge.
Web: Sports Viz Sunday
X: #SportsVizSunday
Real World Fake Data
Create business dashboards using provided data sets for various industries and departments.
Web: Real World Fake Data
X: #RWFD
Data Plus Music
A monthly project visualizing the data behind the music we love!
Web: Data Plus Music
X: #DataPlusMusic
BizViz52
A weekly project centered around designing business dashboards.
Web: BizViz52
X: #BizViz52
Articles sur des sujets connexes

DataFam Roundup June 2026

DataFam Roundup May 2026

Iron Viz 2026: Read Between the Data
 mai 28, 2026