DataFam Roundup: March 27-31, 2023


Welcome! Dig into this week's DataFam Roundup—a weekly blog that brings together community content all in one post. As always, we invite you to send us your content—and the DataFam content from your peers that have inspired you! Find the content submission form here.
Community Highlight
To recognize new and consistent Tableau contributors—we’re excited to have a section within the weekly DataFam Roundup called the Tableau Community Highlight. Find out how to get involved.

Louis Yu, Data Visualization Lead, Data & AI at 2K Games
Singapore
Louis Yu is the Data Visualization Lead of Data & AI at 2K Games, co-lead of the Singapore Tableau User Group, and co-lead of the #GamesNightViz community project. In addition, Louis and his team at work run an internal forum called Knights of the Pie Table, similar to a Tableau User Group, where they host Tableau Data Doctor sessions, and share standardized design principles, best practices, and what's new in the data viz community.
Louis began his Tableau journey through a graduate program at the Maryland Institute College of Art. He applied skills from the classroom to vizzes on topics that interest him, such as video games and Marvel, and published them on Tableau Public, which was his door into the Tableau Community. Some vizzes Louis has published pertaining to his interests:
- Bringing back the CHARM to Baltimore (Louis’s very first #VOTD!)
- The Coffee World
- The Superhero Race
- So you're a parent working from home?
- Dark Origins of Disney Princesses
- Gerrymandering in a Post-Apocalyptic World
Apart from his other involvements in the community, Louis has stayed active by joining community projects such as #MakeoverMonday, taking part in IronViz (and placing in the top 15 this year!), attending Tableau Conference, and interacting with the DataFam on Twitter.
Next for Louis is a blog series that he plans to start soon, refactoring his work for 2K's Knights of the Pie Table and the Singapore TUG, and adding content that will go behind the scenes of some of the vizzes he has created. He is also working with his co-leads to plan a second season of #GameNightsViz.
Connect with Louis on Linkedin, Twitter, through the Singapore Tableau User Group, on Tableau Public, and at Tableau Conference 2023.
Women's History Month with the Tableau Community
- Weekly Viz of the Day's Each week Tableau Public will be featuring a viz celebrating Women's History Month.
- Community Data Visualization Challenges: The DataFam has launched a series of data challenges celebrating Women's History Month. Check them out below!
-
Back to Viz Basics - Visualize Data in a Timeline: As we celebrate International Women's Day and Women's History Month, it's important to recognize the incredible contributions that women have made to our world. In honor of this occasion, this week's data is on Nobel Prize laureates (a person who is honored with an award for outstanding creative or intellectual achievement), with a particular focus on the achievements of female laureates.
-
ProjectHealthViz - Impact of Endometriosis on in Vitro Fertilization Outcomes – Data set from a research paper and aims to highlight the invisible struggle many women with endometriosis face when trying to get pregnant. March is Women’s History Month and it’s important to bring awareness to fertility struggles and the huge hurdles women and their partners go through in hopes of having a family.
-
Diversity in Data - A compilation by Thoughtco.com of the 100 most popular women in history by internet searches
-
DataFam content
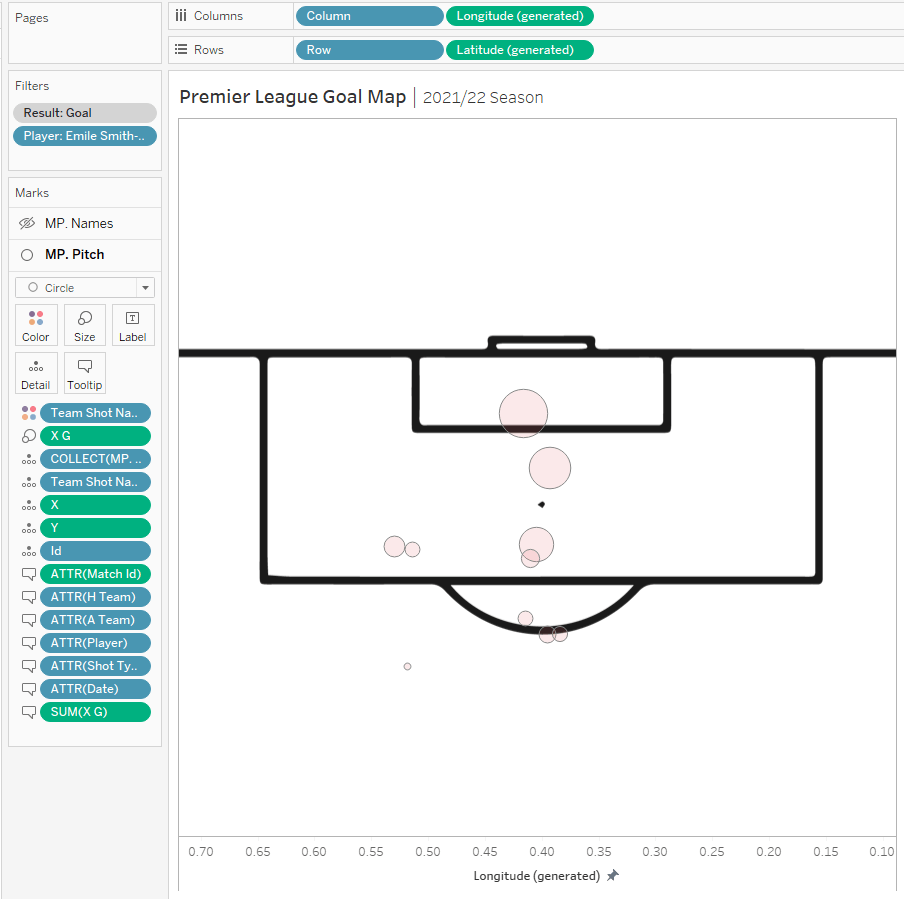
CJ Mayes: Soccer Shot Map Small Multiples
Dive into content created by the Tableau Community:
- Slalom Salesforce: Getting Sales Analytics into the Flow of Work with Slack
- Sekou Tyler: Ten Minute Tuesday with Dzifa Amexo
- Donabel Santos, Sqlbelle: Tableau for Beginners - Shared Axis vs Dual Axis Charts (aka Combined Charts vs Combo Charts)
- Beso Elbakidze: Beso Elbakidze on LinkedIn: #vizgames #netzero #climatechange #datafam
- CJ Mayes: Soccer Shot Map Small Multiples
- Dorian Banutoiu: Refreshing Real-Time Data in Tableau: Adding a Dashboard Button for Dynamic Data Updates
Team Tableau
-
Celebrating the DataFam and 3 Million Profiles on Tableau PublicAnnouncing the 2023 Tableau Visionaries
Upcoming events and community participation
-
TrailblazerDX ’23 Tableau Quest: Leverage the power of data with the world’s leading analytics platform to drive better business decisions.
-
The 2023 Vizzies Award Nominations: The Tableau World Podcast established the Vizzies as a way to recognize individuals in the Tableau community who are not recognized through the visionary program. It is our goal that these awards are diverse and inclusive of the Tableau community. So without further ado, we present the 8th Annual Vizzies. Nominations are open through March 31st. Winners will be announced live on stage at TC23! How do you nominate someone? It's super easy. Just fill out the nomination form by typing in the person's name.
-
Community Calendar and Upcoming Events: stay up-to-date on the latest Women in Dataviz events and other data visualization-related events. If you'd like to submit an event to the calendar, please fill out this form.
Vizzes
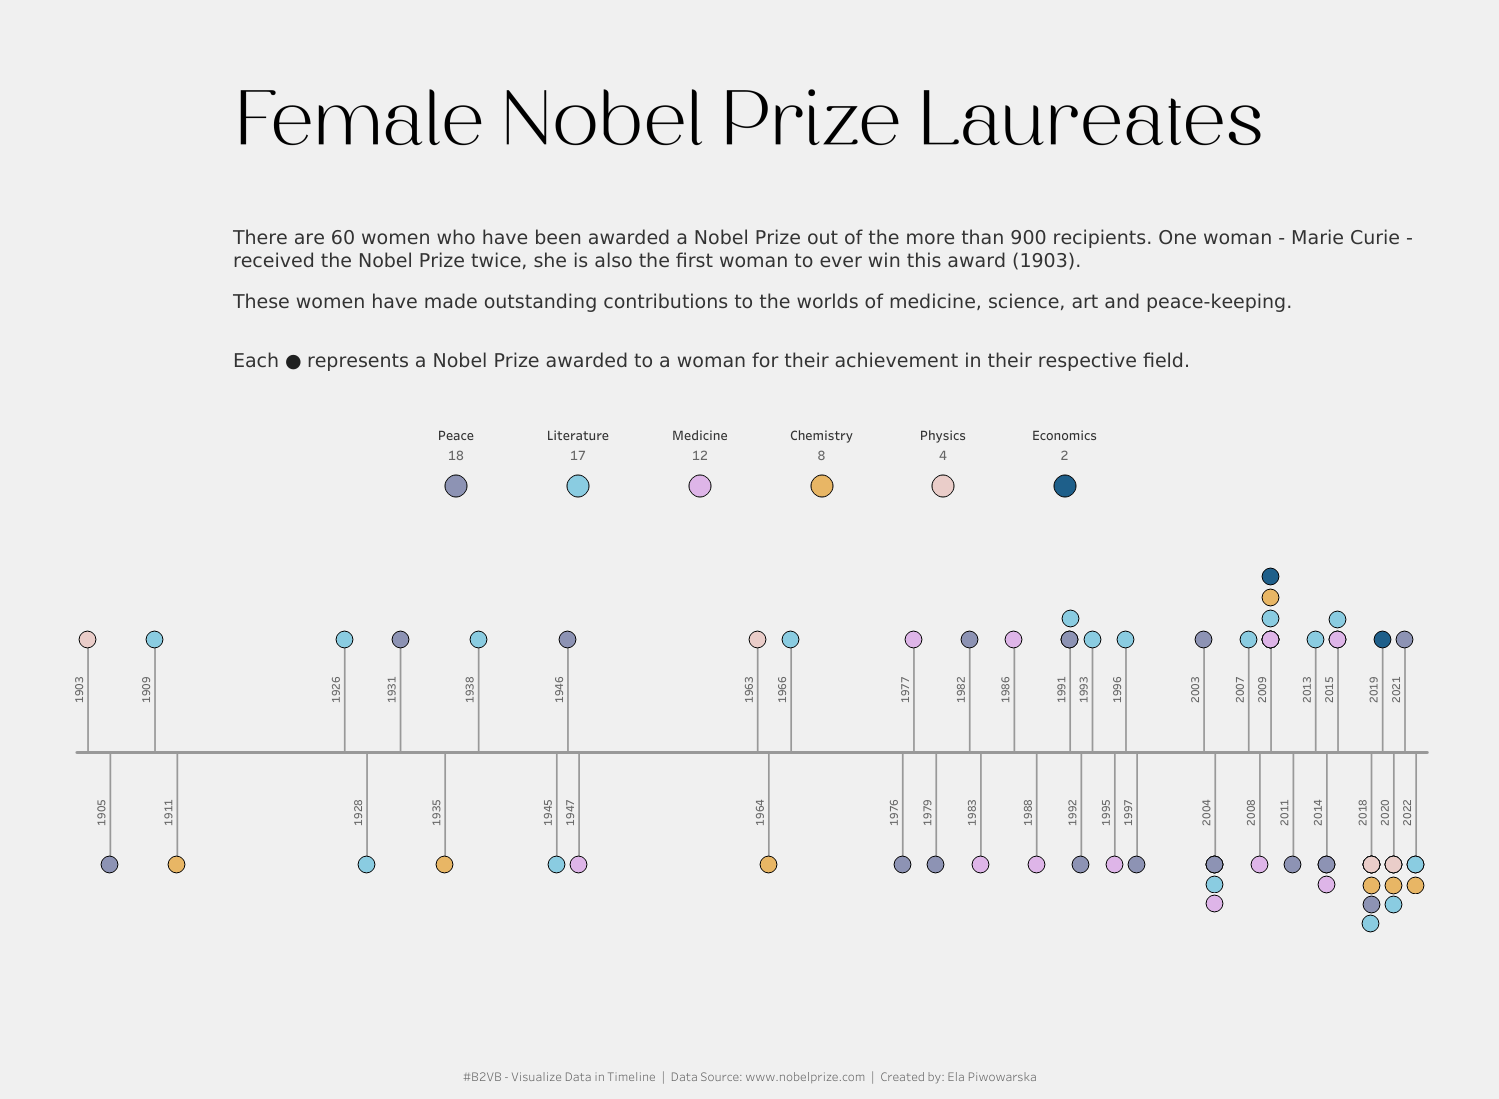
Ela Piwowarska: VOTD | #B2VB - Female Nobel Prize Laureates
See the latest Viz of the Day, trending vizzes, featured authors, and more on Tableau Public.
Check out some inspirational vizzes created by the community:
-
Lindsay Betzendahl: Endometriosis and IVF Outcomes - #ProjectHealthViz
-
Roseclare Ohanwe: Airbnb Full Project
-
Keren Aharon: Superstore Sales Overview
-
Ela Piwowarska: VOTD | #B2VB - Female Nobel Prize Laureates
-
Rebecca Finlay: #B2VB 2023 Week 5 | Female Nobel Prize Laureates
Community Projects
Back 2 Viz Basics
A bi-weekly project helping those who are newer in the community and just starting out with Tableau. Not limited just to newbies!
Web: Back 2 Viz Basics
Twitter: #B2VB
Week 6: Use Brand Colors
Workout Wednesday
Build your skills with a weekly challenge to re-create an interactive data visualization.
Web: Workout Wednesday
Twitter: #WOW2022
Week 13: Can you use dynamic axis titles?
Makeover Monday
A weekly social data project.
Web: Makeover Monday
Twitter: #MakeoverMonday
Week 13: The Gender Pay Gap in US World Cup Bonuses
Preppin' Data
A weekly challenge to help you learn to prepare data and use Tableau Prep.
Web: Preppin’ Data
Twitter: #PreppinData
Week 13: Rolling stock price trends
DataFam Con
A monthly challenge covering pop culture and fandoms.
Web: DataFam Con
Twitter: #DataFamCon
February 2023: (Reality) Love is in the Air!
EduVizzers
A monthly project connecting real education data with real people.
Web: Eduvizzers
March 2023: Strategic Measure Number of Apprenticeship and Internship Positions Offered by the City of Austin
Games Night Viz
A monthly project focusing on using data from your favorite games.
Web: Games Nights Viz
Twitter: #GamesNightViz
Level 6: The Final Boss
Iron Quest
Practice data sourcing, preparation, and visualization skills in a themed monthly challenge.
Web: Iron Quest
Twitter: #IronQuest
Storytelling with Data
Practice data visualization and storytelling skills by participating in monthly challenges and exercises.
Web: Storytelling with Data
Twitter: #SWDChallenge
March 2023: remake a famous graph
Project Health Viz
Uncover new stories by visualizing healthcare data sets provided each month.
Web: Project Health Viz
Twitter: #ProjectHealthViz
March 2023: Impact of Endometriosis on in Vitro Fertilization Outcomes
Diversity in Data
An initiative centered around diversity, equity & awareness by visualizing provided datasets each month.
Web: Diversity in Data
Twitter: #DiversityinData
March 2023: Women's History Month
Sports Viz Sunday
Create and share data visualizations using rich, sports-themed data sets in a monthly challenge.
Web: Sports Viz Sunday
Twitter: #SportsVizSunday
January 2023: Is it a Sport or a Game?
Viz for Social Good
Volunteer to design data visualizations that help nonprofits harness the power of data for social change.
Web: Viz for Social Good
Twitter: #VizforSocialGood
Mar 23 - Apr 18, 2023: World Health Organization (WHO)
Real World Fake Data
Create business dashboards using provided data sets for various industries and departments.
Web: Real World Fake Data
Twitter: #RWFD
Session 5: Diversity Score Card
Data Plus Music
A monthly project visualizing the data behind the music we love!
Web: Data Plus Music
Twitter: #DataPlusMusic
Historias relacionadas

DataFam Roundup June 2026

DataFam Roundup May 2026

Iron Viz 2026: Read Between the Data
 28 Mayo, 2026