The viz that reigned supreme at Iron Viz 2015


It was the 20 tensest minutes of all of Tableau Conference.
Three of the world’s preeminent data artists gathered in Viz Stadium at the MGM Grand. Shine Pulikathara, Matt Chambers, and Skyler Johnson had all come to claim the same coveted glory. But as host Ross Perez made clear, “only one can walk away with the prize”—$2,000 and the title of Iron Viz Champion. Here is the video that welcomed attendees into Viz Stadium:
The contestants’ common ingredient was a GDELT data set on global events, statements, and news coverage from January 2014 to October 2015. “We know who said it, who they said it to, when they said it, and where it happened. Perhaps most importantly, we have the source URLs," said Ross. "In short, we have the pulse of the world’s conversation.”
So it was ready, set, viz with 20 minutes on the clock, Tableau on each screen, and a sous vizzer for each contestant. The audience followed each drag and drop as the clock counted down and tensions rose.
Being on stage in the Iron Viz Arena is “frightening,” said judge and 2012 Iron Viz champion Anya A’Hearn. “You just try to focus on what you’re doing and concentrate.” But the contestants remained cool, nary a sweat bead to be seen in the bright lights, even as their cursors moved about at lightning speed.
With three minutes still left on the clock, Skyler shocked the crowd when he put down his mouse. Was he done? Yes! He’d finished early, prompting Ross to ask, “Are you worried you could’ve done more?” But Skyler’s answer remained a firm no. He'd come prepared to viz his best.
When the clock struck zero, the judges took a closer look, judging on visual aesthetics (20 points), visual best practices (35 point), and the strength of the story (35 points). The audience took to Twitter to vote for their favorites. The contestant with the most popular vote earns 10 extra points.
The judges had many good things to say about each contestant’s work. But of course, there can only be one champion.
And so came the moment of truth as Ross announced the winner: “And the winner of Iron Viz 2015 is…Shine!”

Here’s the winning viz, which lets you to explore key world events by country. Click on Nigeria, and you see the Boko Haram kidnappings. Click on Nepal, and there’s the recent earthquake. Hover over any bar, and the tooltip includes a link to news articles about that event and another link for news images.
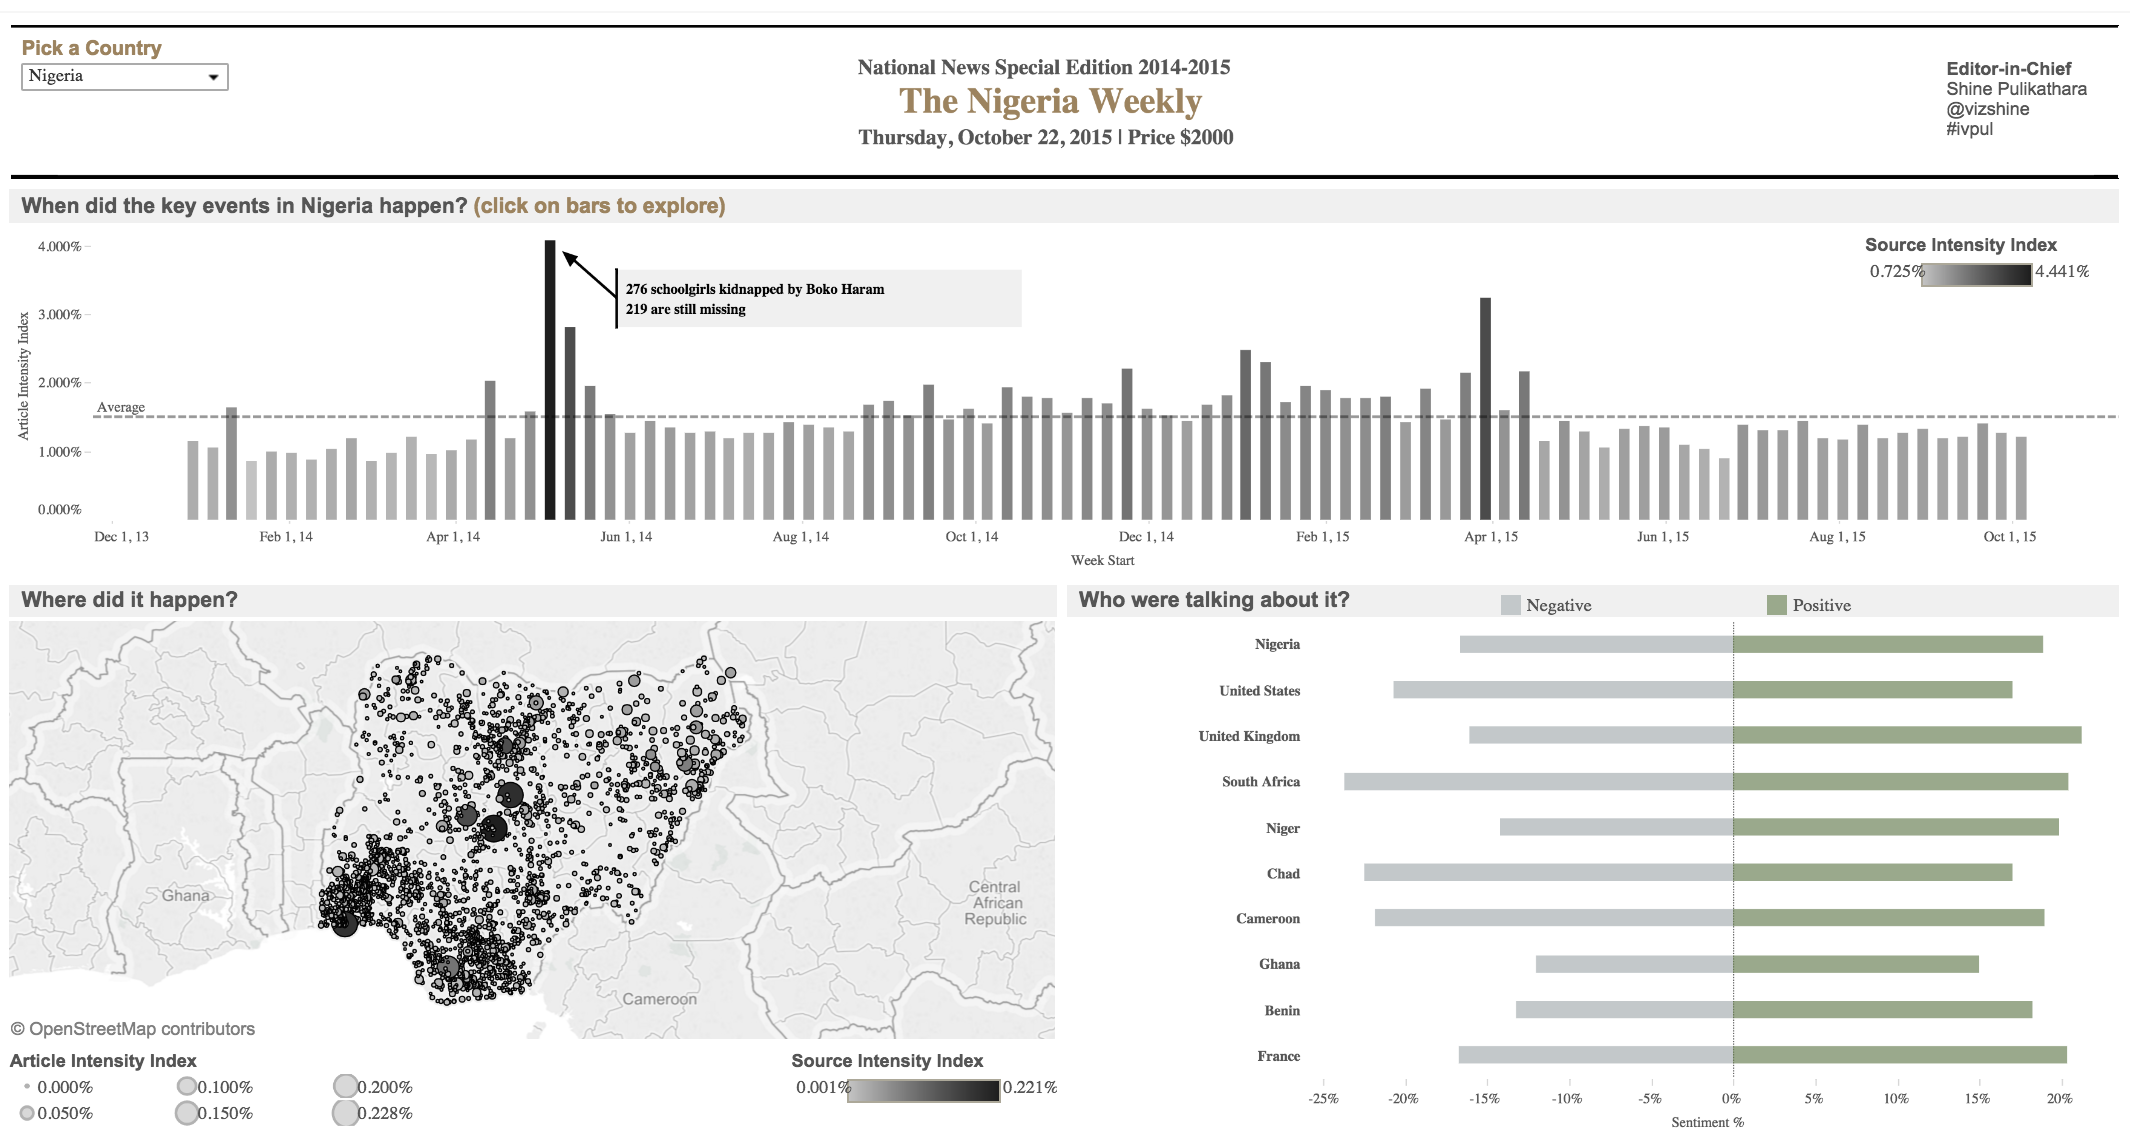
So what did the judges think? Anya put it succinctly: “You rocked it, baby.” The judges liked the flow of the dashboard as well its intuitive simplicity. “You’re using a bar chart, which is really the way to show quantitative data,” said judge and Tableau's VP of Research and Design Jock Mackinlay. There was also Shine’s tasteful addition of the newspaper header and the fact that he’d listed himself as the editor-in-chief.
But really what makes this viz reign supreme is that it allows others to explore their own questions, said judge and Tableau's CMO Elissa Fink.
“I feel like if I see this in Tableau Public, I would download this and start asking more questions,” Elissa said. “I could sit here and explore the data for hours."
And so a new Iron Viz champ was made. Congratulations to Shine, the new Iron Viz champion! As Jock put it, it takes “absolute excellence” to win this title.
If you haven’t yet met Shine, visit his Tableau Public page to see more of his work. You can also check out the vizzes that Matt and Skyler made in Viz Stadium.
Historias relacionadas

5 Ways to Use Tableau Public to Achieve Your Goals
 11 Enero, 2025

World Mental Health Day: Elevating Awareness Through Data Visualization
 10 Octubre, 2024

From TV Screens to Tableau: Visualize Your Favorite Shows with IMDb
 31 Agosto, 2024