Visualize live Twitter data to spark engagement
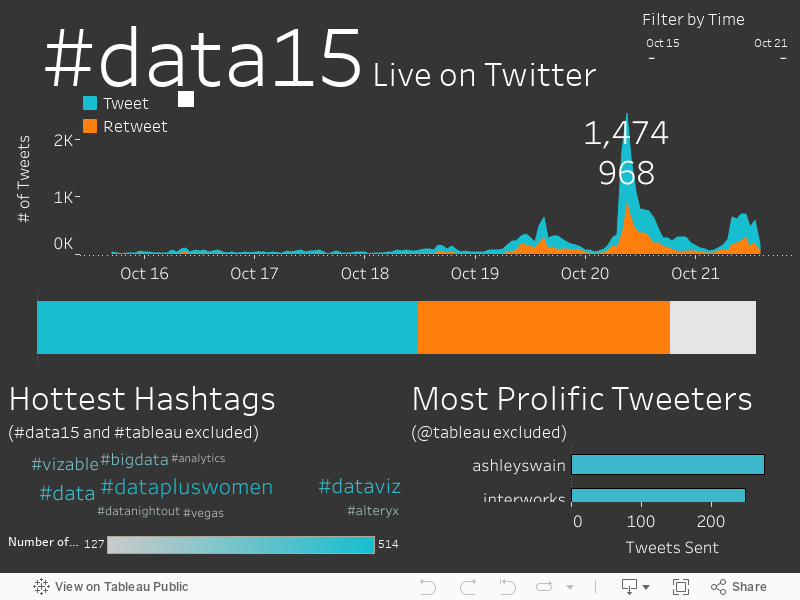
Few things get event participants excited like a live Twitter visualization like this one from Tableau Conference 2015. It shows a week's worth of data covering a series of conference-specific hashtags. Prolific tweeters are rewarded by seeing their name at the top of the lower left chart. More broadly, this dashboard shows how you can use Tableau to monitor social media sentiment in real-time.