Tableau Server 10.5 Scalability
Worldwide, organizations are empowering people to securely access, create, and share data and analytics on their Tableau platform that is right-sized to the business demand it is supporting. They are strategically transforming how they do business by enabling smart, curious people with data, and building a culture of analytics at all skill levels. As adoption and engagement increase, Tableau becomes mission-critical to business operations. This is self-service analytics at scale.
Understanding scalability is essential to deploying Tableau Server, planning for future capacity, and meeting growing business expectations. This paper introduces Tableau Server’s scalable architecture in a multi-node cluster and explores the following:
- Scalability test results for Windows and Linux showing Tableau Server scales nearly linearly by increasing hardware resources
- Variables affecting scalability for new and existing deployments and what to consider when planning your deployment
- Recommendations for your scalability testing
Published: Jan 10, 2018 | Updated: Feb 6, 2018
Introduction
More than ever, the demand for analytics is growing across every aspect of organizations, and it's critical that your data and analytics platform is able to scale to meet these needs. Whether you are talking to decision makers, enterprise architects, or business analysts, “scalability” could mean increasing the number of supported users or amount of content on the platform to execute on the modern analytics vision, expanding the platform architecture and increasing hardware resources to support growing business demand, or increasing the volume of data to be analyzed. While concepts like capacity planning, high-availability, performance tuning are related to scalability, they will be introduced below but addressed in detail in future papers. Here, our focus will be on Tableau Server’s scalable distributed architecture.
Since the introduction of distributed architecture in Tableau Server 5.0 over eight years ago, scalability remains one of the fundamental requirements across every release. Continuous innovation yielded the Data Engine in Tableau 6.0, Data Server in Tableau 7.0, a rendering engine rewrite in Tableau 8.0, and completely rearchitected processes in Tableau 9.0.
With Tableau 10.5, we added support for Tableau Server on Linux and launched a new Data Engine powered by Hyper technology throughout the platform, which provides faster queries and data extraction. As we’ve added new functionality, we’ve also invested heavily to ensure that Tableau will continue to scale to support your business.
Scalability Testing
Standardized Isolated Environment
We ran scalability tests in our performance lab on identical physical machines with the following specifications:
- Server Type: Dell PowerEdge R620
- Operating Systems: Microsoft Windows Server 2012 R2 Standard 64-bit or CentOS Linux release 7.4.1708 (Core)
- Processor: 2.6GHz 1x8 physical cores, hyper-threading enabled
- Memory: 64GB
For consistency, with the exception of the reference here, we refer to physical core counts in this whitepaper and always assume hyper-threading is enabled on physical machines.
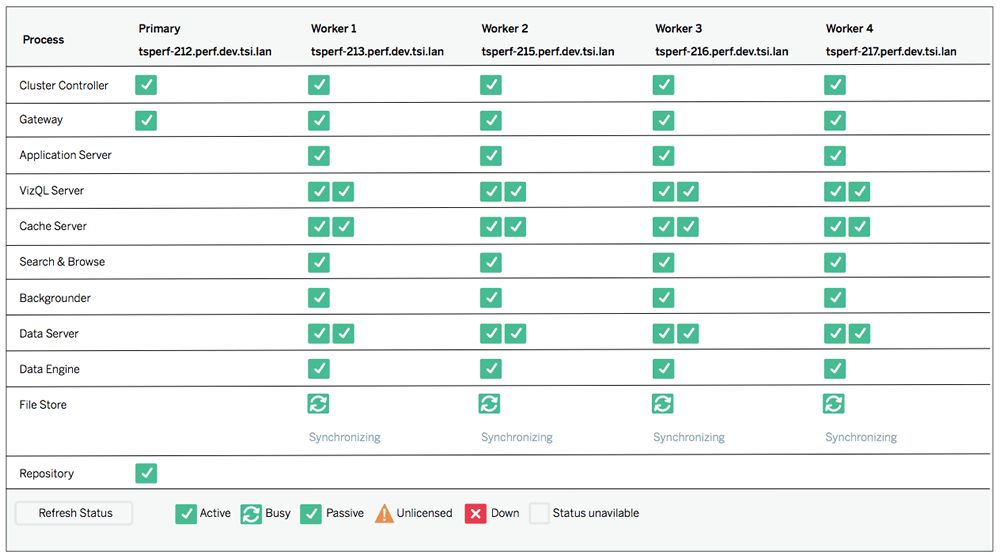
Deployment Topology
Clusters are made up of one primary (controller) node and one or more worker nodes. In our testing, the primary node was configured with a base installation that includes Cluster Controller, Gateway, and Repository processes. Worker nodes were added using the default configuration across each node. Additional configurations are not covered in this test scenario.
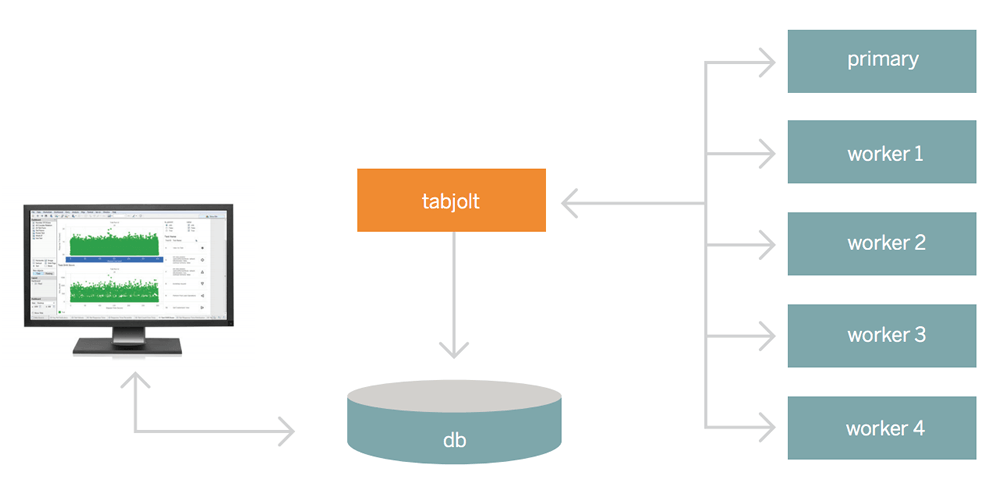
Approach & Methodology
We used our load generator tool, TabJolt, to simulate a mixed workload of live and extract connections with viewing and interacting on a dedicated performance testing environment. TabJolt is a “point-and-run” load and performance-testing tool specifically designed for Tableau Server.
Our testing methodology applies this workload against a single server, ramping the number of simulated users until we observed either the average CPU utilization exceeding 80% (+/- 5%), more than a 2% error rate (Tableau Server HTTP errors), or a degradation in response times. Then, we added additional server capacity and scaled the load linearly, repeating this process from one to four worker nodes in the deployment. The same test workbooks were used across both Windows and Linux test scenarios.
Test Results
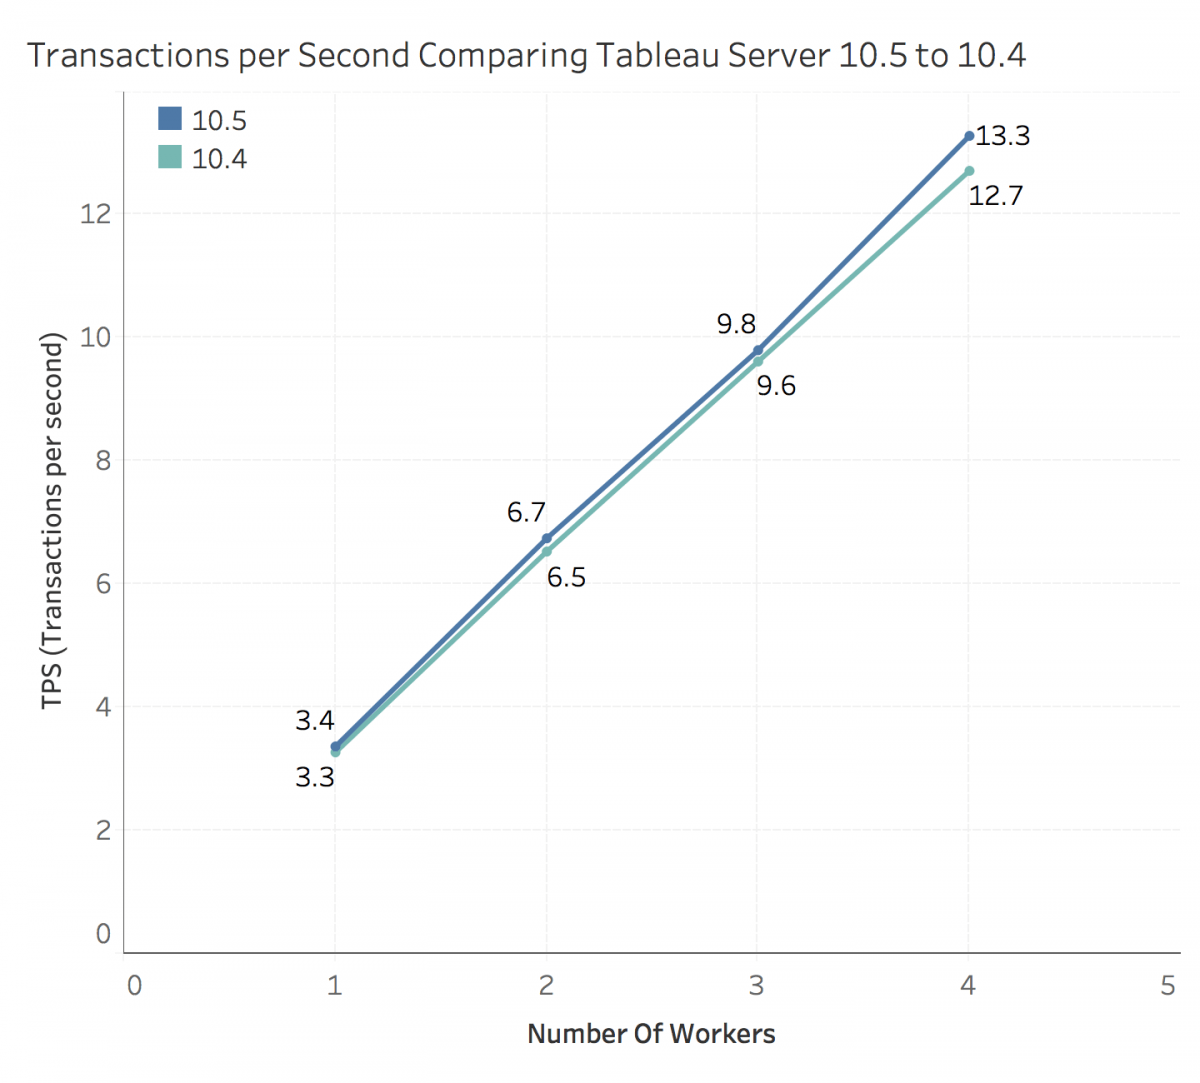
With increasing user loads, we observed that Tableau Server 10.5 scales nearly linearly with load by adding more worker nodes to the cluster for Windows and Linux load tests. The figure below shows the number of user scenarios that were completed per second with increasing workers.
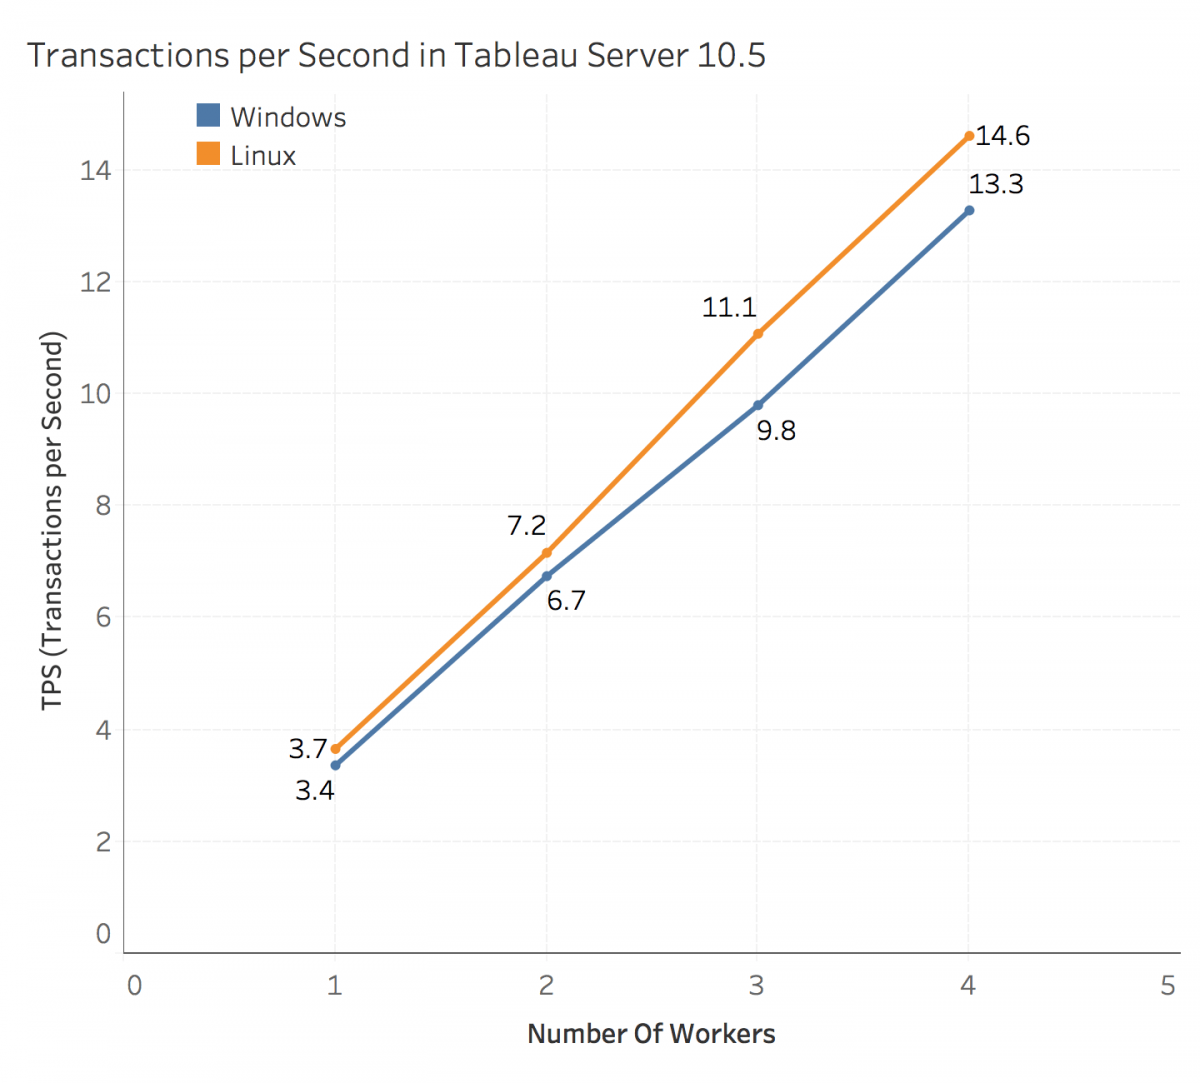
Each point shows the observation for the corresponding cluster topology. The first observation shows the primary/worker cluster configuration with a single worker. For each observation, we add a single worker node, as described earlier, displaying the average Throughput per Second (TPS). Scenario throughput is a relative measure, which includes any user interaction of varying cost, such as viewing a viz and adding filters plus think time. Dividing Scenario Throughput by the number of seconds in the test run, we calculate Throughput per Second (TPS). As shown, TPS increased nearly linearly with the addition of worker nodes.
Adding more workers to distribute CPU load across the cluster optimizes the system by maintaining headroom for load bursts. During these tests, we observed the error rates from the server, and they were well within the 2% goal we had set out as part of the methodology. As we increased the load on the cluster, the CPU utilization stayed within the 75-85% range. The figure below shows the CPU utilization across the cluster with increasing loads.
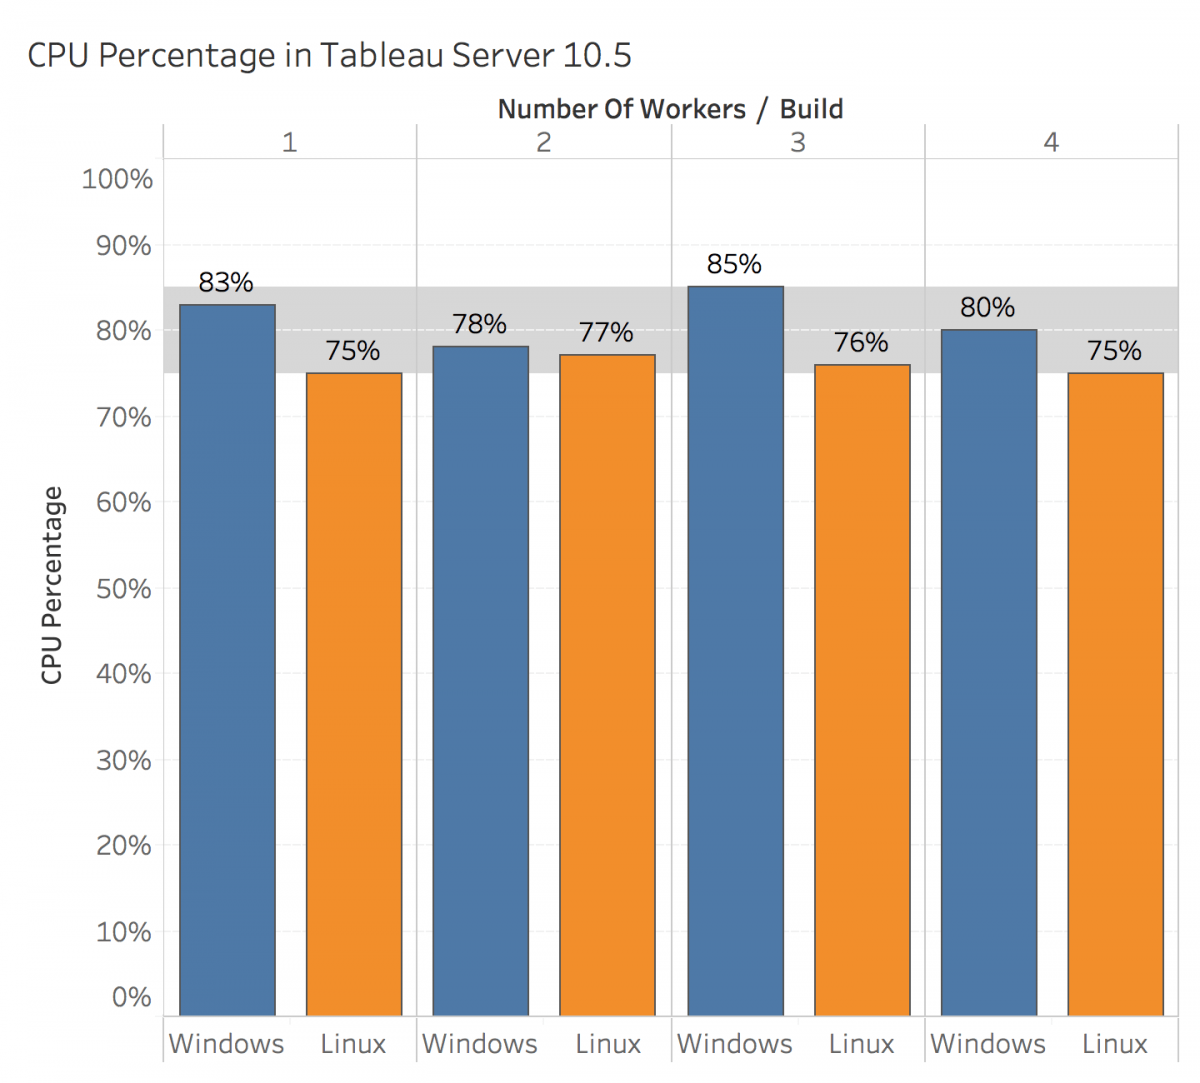
Depending on your workloads, you may see higher error rates, which lower quality of service, when clusters are constrained to fewer machines and/or are limited in capacity.
Under the same methodology run on each Windows version, Tableau Server 10.5 throughput improved slightly when compared with Tableau Server 10.4.
Variables Affecting Scalability
Scalability allows you to be responsive to the increased use of analytics and rapid adoption across your organization by achieving one or more of the following outcomes:
- Increased availability with redundant processes
- Increased capacity and headroom for new use cases and adding new users
- Decreased resource contention and conflicts over shared resources
Like other enterprise platforms, Tableau Server scales up by adding processor, memory, and/or disk or scales out by adding more nodes to a cluster; however, scalability and performance are heavily dependent on external systems and user activity because of the rapid pace that deployments progress. For example, assuming a correctly-sized hardware configuration is deployed, unplanned user onboarding, unmonitored utilization, inefficient workbooks, suboptimal data extract design, and peak-hour refresh schedules can have a major impact on server performance and user experience, causing performance to degrade from the cumulative effect of the separate incidents.
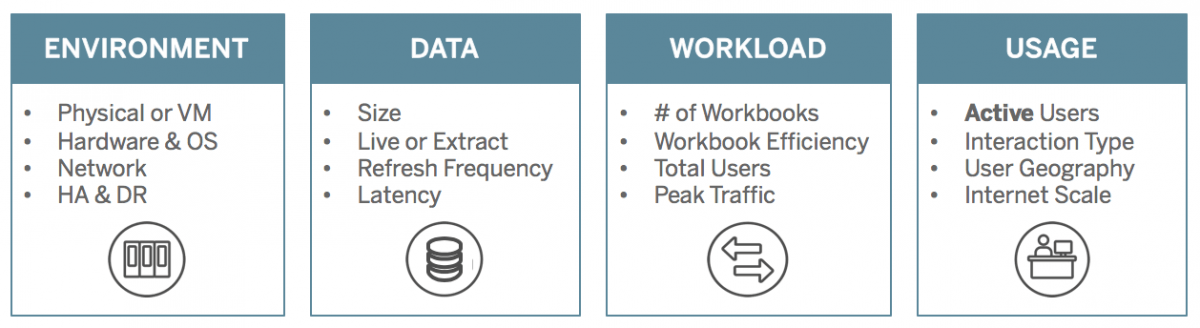
Variables affecting Tableau Server scalability are categorized into four areas. Their impact on Tableau Server scalability, capacity planning, and performance tuning will be evaluated in future papers.
- Environment – Infrastructure upon which the platform will operate
- Data – Sources of data and management strategy to provide self-service data access
- Workload – Work generated by content use cases and potential volume of work
- Usage – Number of active users; how and where they’re accessing the system
Four areas of variability in Tableau Server deployments
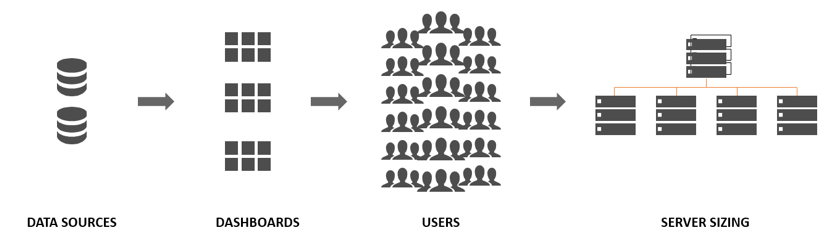
Understanding the relationship between data sources and workbook content, users, and server performance, scalability, and sizing on a timeline is a reliable way to look into future growth and estimate utilization:
- A team or group of users has a known collection of sources of data that can be identified and prepared for them as Published Data Sources or embedded in workbooks.
- Published Data Sources, as well as embedded data sources, are used to populate dashboards.
- Dashboards have a specific audience, or group of users who should view them. User engagement drives server scalability and sizing decisions.
- Server scalability and sizing decisions define hardware and licensing requirements, which are aligned with budget planning and procurement requests.
In both new and existing deployment scenarios, the goal is to proactively maintain sufficient availability, capacity, and headroom and minimize resource contention. The information available will differ for new deployments versus existing ones. This means that you will estimate unknown Workload and Usage variables for new deployments. For existing deployments, you will evaluate data collected from the Tableau Server Repository, load testing, monitored hardware and application metrics, user behavior, and planned new user onboarding to develop the capacity plan. Your Tableau account team is available to assist.
Whether you are planning a new deployment or expanding an existing one, you should consider the combination of all variables to inform your architecture and topology decisions, to scale with evolving business demands and proactively manage the platform. Tools to assist include:
- TabJolt – TabJolt is a “point-and-run” load and performance-testing tool specifically designed for Tableau Server.
- TabMon – TabMon monitors physical (CPU, RAM, disk) and network metrics. You can track cache-hit ratio, request latency, active sessions, and more.
- Logshark – Logshark provides insights about system performance, content usage, and error assessment.
- Replayer – Replayer can take log-based traffic from a Tableau Server, and replay it back against any other server or configuration, even scaling the load up and down.
Environment
Environment variables include all of the infrastructure that Tableau Server connects to and the Tableau Server hardware and its configuration. Tableau can be deployed where you want – on-premises, physical or virtual, or public cloud, such as AWS, Microsoft Azure, or Google Cloud Platform – and integrated into your technology investments without dictating your data and analytics strategy, providing more flexibility than any other analytics platform. For more information on specific deployment options, see the following:
- Minimum Requirements and Minimum Recommendations
- Tableau Server on VMware VSphere
- Tableau Server on AWS
- Tableau Server on Microsoft Azure
- Tableau Server on Google Cloud Platform
Regardless of where you choose to deploy Tableau Server, properly-sized hardware is critical. Your planning should be aligned with evolving business needs by assessing server utilization and user engagement more frequently, scaling more frequently, and changing topology more frequently than other software applications. Tools like TabMon, Windows PerfMon, or dstat for Linux are useful for monitoring hardware utilization. Considerations for scalability and performance include the following:
- Organizational hardware standards, including physical or virtual, operating system, and server configuration
- Redundancy to support service levels for high-availability, starting with a minimum three-node configuration, and/or disaster recovery configuration
- Network configuration for accessing Tableau Server inside and/or outside the firewall
- Architecture and security protocols to support embedded visualizations in a custom portal
Data
Sources of data exist in many places and in different formats, such as files, databases, applications, and cloud-based storage. The Data variables involve all sources of data and your data governance and management strategies for trusted, self-service data access. Considerations to support Tableau Server scalability and performance include the following:
- Inventory known sources of data and create Published Data Sources to reduce disk consumption and CPU utilization related to extract duplication.
- Match data extract size and refresh frequency to analytic needs, rather than a “one-size-fits-all, just in case” approach
- Distributing data refresh and subscription schedules during off-peak hours
- Specializing worker nodes for data extract refresh by isolating the Backgrounder’s non-interactive tasks
Tableau Data Server centrally manages security, governance, and storage for optimized data extracts and database pass-through connections, which are saved as Published Data Sources. Published Data Sources are reusable and contain everything workbook authors need to connect to data and start authoring, including any required database drivers, the data extract itself, information for a live database connection, as well as custom calculations, hierarchies, groups, or sets.
Because one published data source can be used by many workbooks, Tableau Server resources are utilized more efficiently. Extract refreshes can be scheduled per-extract instead of per-workbook, and when a workbook using a Tableau Server data source is republished or downloaded, the data extract stays on the server, reducing network traffic. Auditing data connections and extract schedules will allow you to effectively manage published data sources and avoid extract schedule saturation.
In 10.5, the new Data Engine powered by Hyper technology enables faster query response time and faster extract time. Extracts are generated almost as fast as the source system can deliver the data, so users can perform analysis with fresh data using fewer resources during the extract creation process. As the number and size of data extracts increase, Tableau Server scalability and performance may be improved by specializing one or more cluster nodes for Backgrounder task execution. Extract refresh delays may indicate the need for node specialization. Following data extract best practices, data stewards and workbook authors should remain focused on only the data needed for the analysis by using extract filters, hiding unused fields, aggregating to higher levels, and deleting unused calculated fields.
Workload
The Workload variables represent the total potential amount of work to be supported by the platform. Considerations for scalability and performance include:
- Number of workbooks reflecting increasing number of use cases
- Workbook efficiency and unmanaged content
- Total users to define a capacity plan
- Peak traffic during cyclical periods
Workload changes over time as new users are added, new workbooks are created, and new data sources are published. During month-, quarter-, and year-end activities, cyclical patterns may also spike during certain times of the year. Unnecessary workload may be generated by suboptimal workbook design and/or unused data extract refreshes. Often by applying visual best practices and selecting the appropriate amount of data for the corresponding business questions can measurably improve server performance. Isolated incidents of large crosstab presentations or many filters are not likely to take down a server, but when compounded across many occurrences, the effects of tabular, unfocused content will impact server scalability and performance. Tableau Server’s Administrative Views can identify poorly performing or stale content for optimization with best practices or removal from the server.
Using TabJolt and Tableau Server’s nearly linear scalability principle, set the 12- to 18-month planning outlook at three- or six-month intervals for hardware and licensing needed to support the workload of the expected number of users. Instead of opening the platform to all potential users immediately, a planned deployment approach, including scheduled user onboarding, education, data and analytics governance processes, license management, and support, gives Tableau Server Administrators and Site Administrators the opportunity to establish standard monitoring metrics for workbook efficiency, data refresh frequency, and usage patterns to determine the appropriate server sizing for their unique environment, data, workload, and usage mix.
Usage
The Usage variables include the number of active users and where and how they’re accessing Tableau Server, which represent the actual amount of work executed by Tableau Server. Usage patterns will develop from initial proofs-of-concept into widely-adopted dashboards driving business value. Considerations for scalability and performance include:
- Active users and concurrent requests
- Interaction type, direct and indirect
- User geography across multiple time zones
- Internet-scale deployments
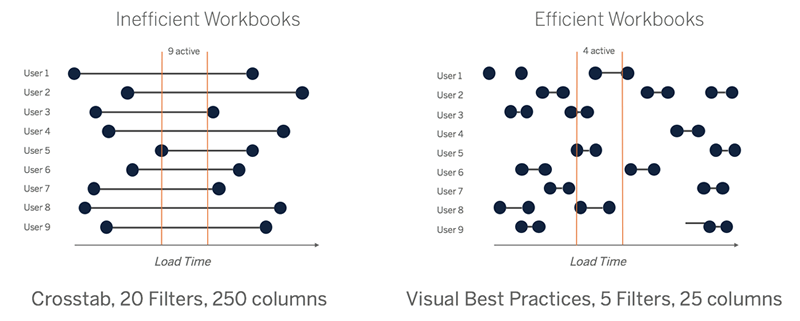
Active users represent the interactive, concurrent requests made to Tableau Server, including consuming dashboards on a laptop or mobile device, web authoring, and connecting to and querying Published Data Sources. Depending on the number and complexity of those requests, available CPU and/or memory may be consumed to a point that impacts scalability and performance. Building on concepts discussed in the Workload variable above, efficient workbooks and data sources employing best practices are key to scaling Tableau Server. In the simple example below, we can see how long load times create more simultaneous active user requests on the left. After applying best practices, the active user count reduced from 9 to 4 during the sampled time interval as a result of designing for efficiency while the viewer interacts, analyzes the results, and interacts again on the right.
Additionally, it is important to evaluate the non-interactive use cases from subscriptions and alerts. Combined with extract refresh delays, mentioned in Data variables, subscription delivery delays may indicate the need to specialize one or more cluster nodes for Backgrounder task execution. Widely-dispersed user geography across multiple time zones will also increase the need to specialize Backgrounder nodes because there will never be a preferred off-hour extract refresh period. Special considerations should be made for Internet scale deployments, which can be further explored with your account team.
Summary
As mentioned previously, our testing focuses on the ability of Tableau Server to scale nearly linearly for a given workload. Because the performance of Tableau is dependent on your usage scenarios, we encourage you to perform your own testing.
- Tableau is designed to scale up and scale out and it helps to inform scalability testing by understanding Tableau architecture to drive the outcomes for your use cases.
- Pick the right tool for testing. There are many load testing tools available but Tableau differs from other applications in the heterogeneity of its workload. We recommend the use TabJolt for testing because it is a “point and run” load testing tool specifically designed for Tableau Server.
- Select representative content from your top-viewed workbooks. Often the cause of scalability and performance issues is the workbooks being used are not authored with best practices in mind. If a single-user test on your workbooks shows a very slow response time, then you should optimize those workbooks before you begin a load-testing project.
- Start with the default process configuration determined by Tableau Server’s architecture-aware installer and scale up or out as needed. In most cases, increasing process counts above the defaults does not improve performance, unless sufficient hardware resources are available. With Replayer, you can replay log-based traffic from your Tableau Server against another server configuration.
- Monitor Performance - Performance data informs future sizing and the capacity plan. Some of this data, including load time data and extract refresh data, is already accessible from the Administrative Views that are built into Tableau Server; however, to collect resource usage data you need to use external performance monitoring and load testing tools – TabMon, Logshark, and TabJolt.
- Resource Usage Data – How Tableau Server uses hardware resources like CPU, RAM, and disk.
- Session and Load Time Data – How users interact with Tableau Server, including how long it takes for views to load and how many concurrent users there are.
- Background Task Data – How Tableau Server runs tasks that are not directly tied to a user action. For example, background tasks include extract refresh tasks, subscription tasks, and alerts.