Visualizing Every Single Street in San Francisco, in collaboration with Rickey Gates


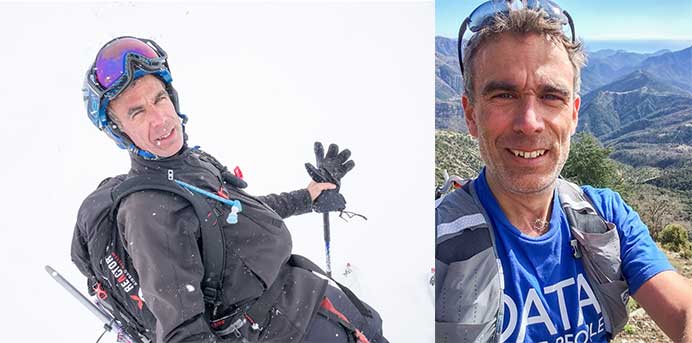
One day Amanda Boyle, Community Manager at Tableau sent us a message asking if someone would be interested in visualizing an exciting project around running data. The project was to visualize Rickey Gates’ newest adventure. Rickey Gates is one of the most recognized extreme runners in the world. For his Every Single Street project, he ran every single street in San Francisco over the course of 46 days—running on average 7:22 hours and 29 miles (47kms) a day. That adds up to a total of over 1,317 miles.
At the time, I did not know anything about Rickey Gates or his global reputation. He was a member of the U.S. mountain-running team, and won many races like the 2011 Canadian Death Race, a 125 km event. He even ran across his homeland, the United States, unsupported in 2017. I live in the South of France and at work, I try to run during my lunch breaks with a group of runners. I told them about Rickey and they said, “You don’t know him? He ran across the U.S. unsupported...” Then I had a look at his Strava account and saw that he ran more than 200 miles (300kms) and more than 40 hours in the past week.

I love running, walking, and ski touring in the mountains, so at first, I was surprised that someone like Rickey—who like me, is a mountain native, and did all his previous adventures in the wild—ended up running the streets of a big city for more than five weeks. But when I read his blog and saw the documentary published by Salomon, one of his sponsors, I understood and loved his approach. Yes, he loves being in the wild, in quiet, open and peaceful places, but he also loves people, and most people live in big cities. His plan was to better know his hometown by interacting with people living in San Francisco— as Rickey says, to “create a pathway towards empathy and knowing how other people live.”
I was impressed and inspired by Rickey Gates and decided to answer Amanda's proposal. Rickey was kind enough to let me visualize his adventure and gave me access to all his routes, that he recorded with a Suunto watch and that he also shares on Strava. I took this project very seriously. For me, it was a big responsibility to try to materialize such an incredible adventure that required so much dedication and effort.
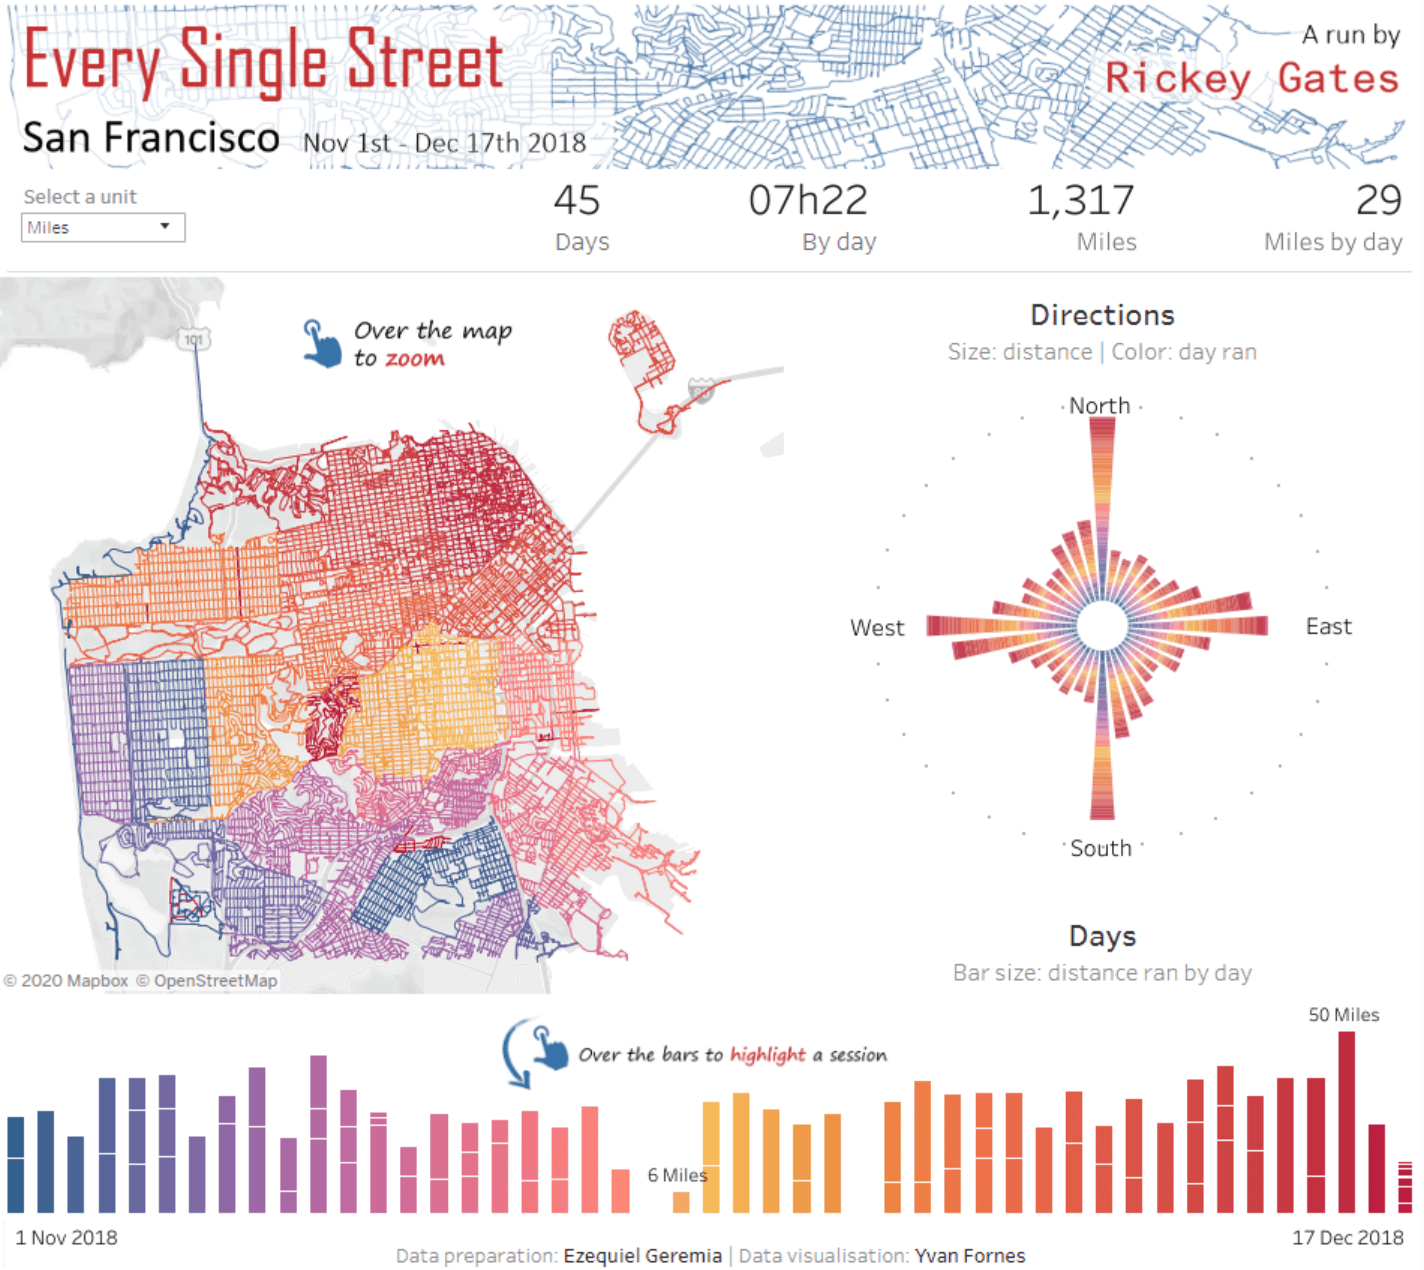
Every Single Street visualization
A team effort: Collecting and preparing running route data from Strava
I started to work on the data preparation alone, but I quickly understood that I would need some help. The data was composed of more than 80 GPX files, that contains more than 900,000 records (one record for every second Rickey’s runs). GPX files are XML file format that are not read by Tableau or Tableau Prep. I contacted my colleague Ezequiel Geremia, a Data Scientist at Amadeus. He was excited by the project and proposed his help straight away.
Ezequiel spent a few evenings after work converting, cleaning, enriching and compressing the data. Our goal was to show all of Rickey’s run routes on one map. But we couldn’t display 956,016 data points generated by Rickey on one map. It would have been too busy and hard for the viewer to understand the full context.
To solve this, Ezequiel used an existing Python library for parsing and manipulating GPX files (gpxpy), he created a few functions that you can find on this Github page. With this code, he kept the minimum number of data points without changing Rickey's overall route—basically keeping only the corners of Rickey's routes. Ezequiel was able to reduce the size of the data set by 89%— allowing me to visualize the data in a much more efficient way.
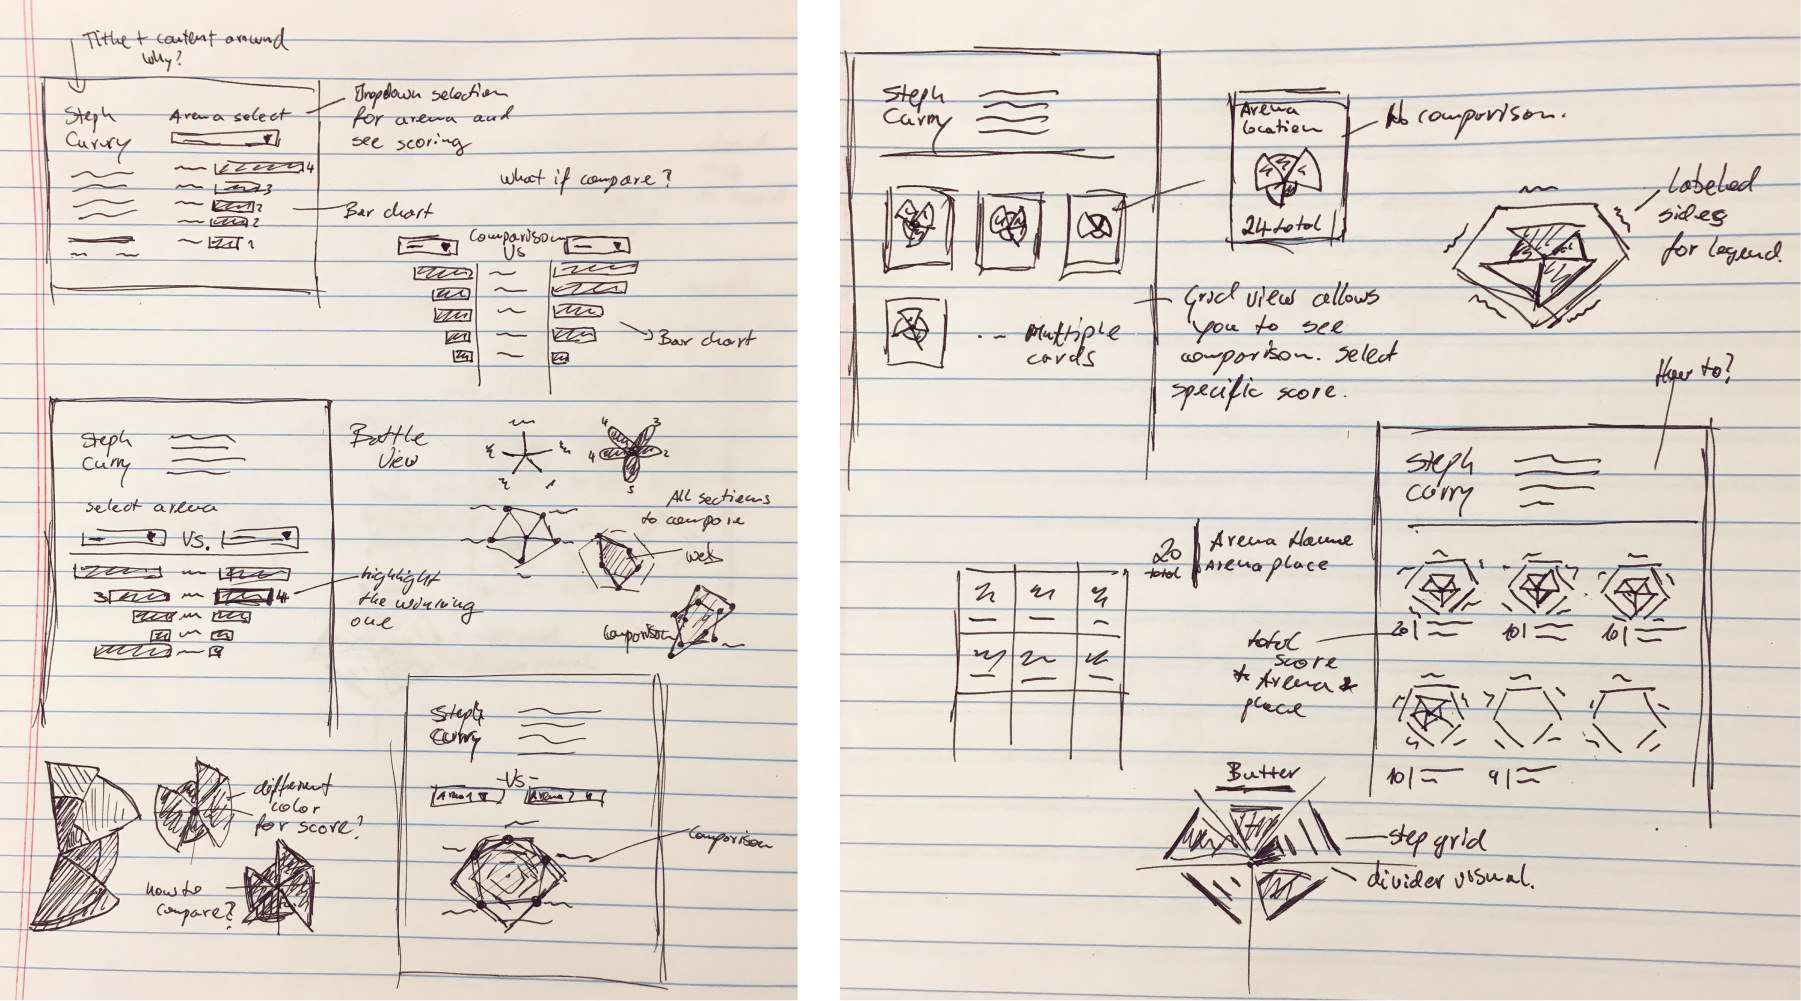
How I built the Every Single Street visualization: My goals and considerations
Before starting the visualization, I had four main goals:
GOAL ONE: Allow the person exploring the viz to see the Every Single Street project through four dimensions—the when, what, where, and how.
- Time: Show the different days that Rickey ran
- Location: Where has Rickey been? How did he create his routes?
- Route: The direction of each run
- Distance: How far and wide he travelled
GOAL TWO: Summarize Rickey’s main accomplishments with figures by day—like distance by day or hours ran by day—to try to show what it takes to accomplish this massive feat. To truly show what it means to run 1317 miles (2119 kms) in 45 days.
GOAL THREE: Add context. Use the San Francisco colors, including the colorful buildings and the Golden Gate Bridge to contextualize the project.
GOAL FOUR: Let the viewer choose the detail. Show the entire Rickey route and at the same time, allow people to dig in and zoom in on a specific day or session.
We proposed our work to Rickey and Amanda and thanks to their feedback, I was able to improve the visualization before coming up with its final form.
If you want to visualize your own adventures—or simply your workout sessions with Tableau—you could use the Strava Web Data Connector. Here is a post I wrote about it.
The Every Single Street project inspired (and continues to inspire) many runners around the world. You can follow them on Twitter with the hashtag: #EverySingleStreet
For more tips, tricks, and vizzes by Yvan, check out his Tableau Public page and connect with him on Twitter @YvanFornes.
Zugehörige Storys

5 Ways to Use Tableau Public to Achieve Your Goals
 11 Januar, 2025

World Mental Health Day: Elevating Awareness Through Data Visualization
 10 Oktober, 2024

From TV Screens to Tableau: Visualize Your Favorite Shows with IMDb
 31 August, 2024