DataFam Roundup: June 5 - 9, 2023


Welcome! Dig into this week's DataFam Roundup—a weekly blog that brings together community content all in one post. As always, we invite you to send us your content—and the DataFam content from your peers that have inspired you! Find the content submission form here.
Community Highlight
To recognize new and consistent Tableau contributors—we’re excited to have a section within the weekly DataFam Roundup called the Tableau Community Highlight. Find out how to get involved.

Felicia Styer, Associate Director of Analytics Solutions at Playfair Data
Missouri, USA
Felicia Styer is the Associate Director of Analytics Solutions at Playfair Data. Felicia stays involved in the Tableau Community through answering questions on Reddit, Twitter, and the Tableau Forums.
Each platform provides unique benefits and challenges, according to Felicia, which is why she chooses to participate in different ways. Felicia likes that the Tableau Forums offer an official place to ask and answer questions, Twitter is active and a great place to connect with the community, and Reddit allows easy navigation and questions are not as easily missed. Helping others directly through these platforms allows Felicia to foster individual connections which has a more meaningful impact to her.
Felicia began her Tableau journey in 2016 through work where she accepted a position without any prior experience. She got involved with community projects including: Makeover Monday, Workout Wednesday, and Bronson Shonk's Challenge Workbook through which she immediately fell in love with Tableau.
Tableau 365 is Felicia’s current project: a personal challenge to answer 365 questions in 2023. Follow her progress on Twitter.
Connect with Felicia on LinkedIn, Twitter, Tableau Public, and on the Tableau Forums.
DataFam content
Dive into content created by the Tableau Community:
-
Adam Mico: #datafam #diversitymatters #inclusionatwork #teamdiversity…
-
Adil Hussain: What Makes A Good Data Visualization?
-
Kasia Gasiewska-Holc, The Flerlage Twins: Automatic Default Chart Granularity
-
Alexander Waleczek, Curvediscussion: The Self-Funding Guide to Tableau Conference
-
Eric Parker, One Number: Apply Filter to Multiple Worksheets in Tableau (Quick Tip)
-
Steve Adams: Tableau Bites 126th Edition
-
Nicole Lillian Mark, SELECT * FROM data: Everything you know about selecting fonts for data visualization is wrong, part 1
-
Judit Bekker: How to use fonts in Tableau?
-
Andy Kriebel, VizWiz: Mastering TABLEAU Dashboards from Scratch
-
Michelle Frayman, Zak Geis and Nicole Klassen: Viz Feedback Office Hours
Team Tableau
-
Celebrate diversity by adding pronouns to your Tableau Public profile
-
Use this viz to find data viz creators available for hire on Tableau Public
-
2023 Iron Viz finalists made earth their viz-ness at Tableau Conference
-
Closing the (ideas) loop: Update re. Tableau product ideas, features & releases
Upcoming events and community participation
-
Chart Chat Live-Round 42: Join Steve, Jeff and Andy as they take one chart and rebuild it in 3 different ways, sharing how and why they make all their decisions along the way.
-
Data Book Club: This spring we'll be reading Avoiding Data Pitfalls: How to Steer Clear of Common Blunders When Working with Data and Presenting Analysis and Visualizations by Ben Jones.
-
TrailblazerDX ’23 Tableau Quest: Leverage the power of data with the world’s leading analytics platform to drive better business decisions.
-
Community Calendar and Upcoming Events: stay up-to-date on the latest Women in Dataviz events and other data visualization-related events. If you'd like to submit an event to the calendar, please fill out this form.
Vizzes
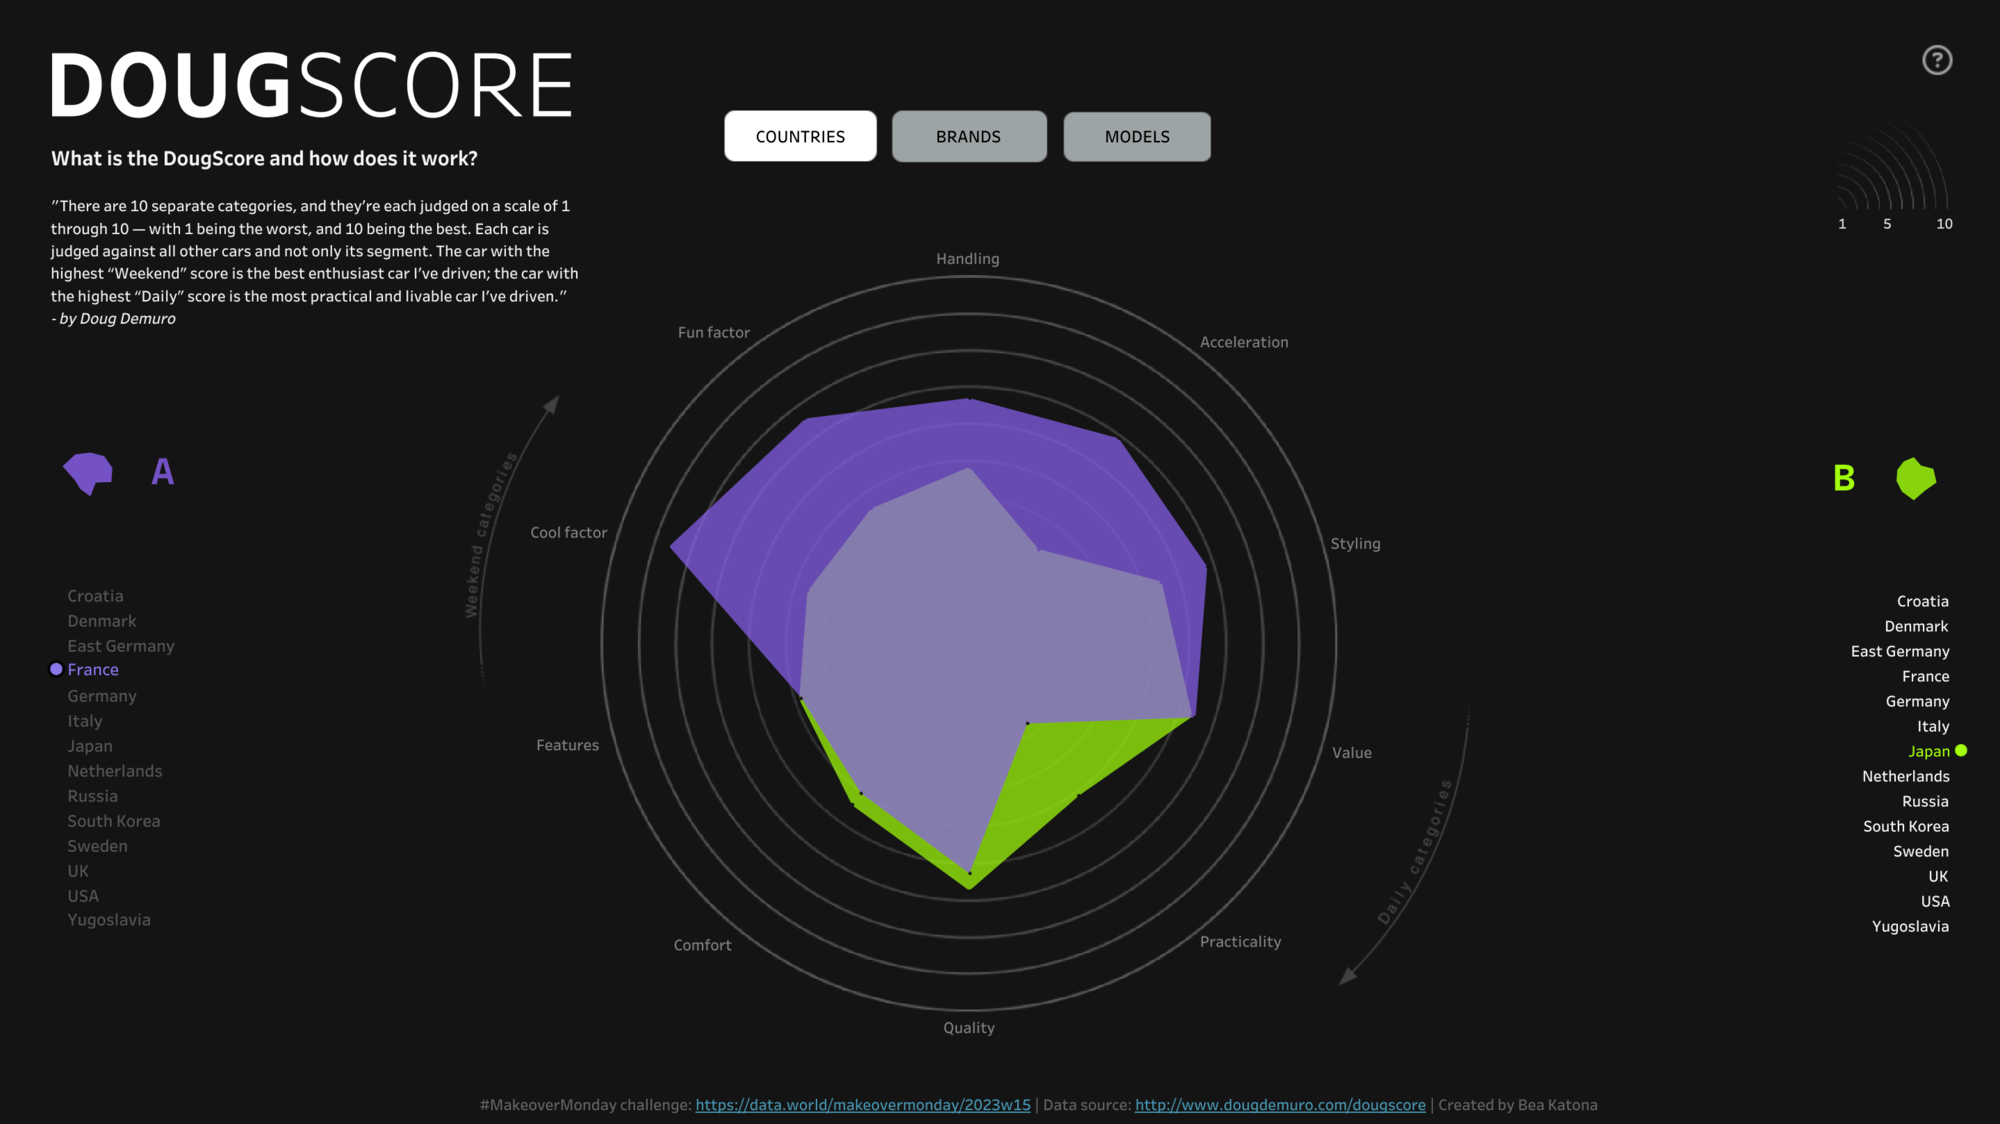
Bea Katona: The DougScore | #MakeoverMonday 2023w15
See the latest Viz of the Day, trending vizzes, featured authors, and more on Tableau Public.
Check out some inspirational vizzes created by the community:
-
Elaine Yuan: Drag Race Represent-Asian
-
Sherry Shen 沈培韵: My 30 Days of AI Creation in Midjourney
-
Bea Katona: The DougScore | #MakeoverMonday 2023w15
Community Projects
Back 2 Viz Basics
A bi-weekly project helping those who are newer in the community and just starting out with Tableau. Not limited just to newbies!
Web: Back 2 Viz Basics
Twitter: #B2VB
Week 11: Build a Map
Workout Wednesday
Build your skills with a weekly challenge to re-create an interactive data visualization.
Web: Workout Wednesday
Twitter: #WOW2022
Week 22: Filtering and Highlighting
Makeover Monday
A weekly social data project.
Web: Makeover Monday
Twitter: #MakeoverMonday
Week 22: Melbourne’s Pedestrian Counting System
Preppin' Data
A weekly challenge to help you learn to prepare data and use Tableau Prep.
Web: Preppin’ Data
Twitter: #PreppinData
Week 22: Student Attendance vs Test Scores
DataFam Con
A monthly challenge covering pop culture and fandoms.
Web: DataFam Con
Twitter: #DataFamCon
April 2023: Kids Month!
EduVizzers
A monthly project connecting real education data with real people.
Web: Eduvizzers
June 2023: OECD Programme for International Student Assessment
Games Night Viz
A monthly project focusing on using data from your favorite games.
Web: Games Nights Viz
Twitter: #GamesNightViz
Level 6: The Final Boss
Iron Quest
Practice data sourcing, preparation, and visualization skills in a themed monthly challenge.
Web: Iron Quest
Twitter: #IronQuest
Advanced Chart Types
Storytelling with Data
Practice data visualization and storytelling skills by participating in monthly challenges and exercises.
Web: Storytelling with Data
Twitter: #SWDChallenge
June 2023: fun with fonts
Project Health Viz
Uncover new stories by visualizing healthcare data sets provided each month.
Web: Project Health Viz
Twitter: #ProjectHealthViz
May 2023: WHO’s Global Report on Health Equity for Persons with Disabilities
Diversity in Data
An initiative centered around diversity, equity & awareness by visualizing provided datasets each month.
Web: Diversity in Data
Twitter: #DiversityinData
May 2023: Mental Health Awareness Month
Sports Viz Sunday
Create and share data visualizations using rich, sports-themed data sets in a monthly challenge.
Web: Sports Viz Sunday
Twitter: #SportsVizSunday
January 2023: Is it a Sport or a Game?
Viz for Social Good
Volunteer to design data visualizations that help nonprofits harness the power of data for social change.
Web: Viz for Social Good
Twitter: #VizforSocialGood
Apr 18 - June 6, 2023: World Health Organization (WHO)
Real World Fake Data
Create business dashboards using provided data sets for various industries and departments.
Web: Real World Fake Data
Twitter: #RWFD
Session 5: Diversity Score Card
Data Plus Music
A monthly project visualizing the data behind the music we love!
Web: Data Plus Music
Twitter: #DataPlusMusic
Zugehörige Storys

DataFam Roundup June 2026

DataFam Roundup May 2026

Iron Viz 2026: Read Between the Data
 28 Mai, 2026