DataFam Roundup: April 1–5, 2024


Welcome! Dig into this week's DataFam Roundup—a weekly blog that brings together community content all in one post. As always, we invite you to send us your content—and the DataFam content from your peers that have inspired you! Find the content submission form here.
Community Highlight
To recognize new and consistent Tableau contributors—we’re excited to have a section within the weekly DataFam Roundup called the Tableau Community Highlight. Find out how to get involved.

Ali Agah, Senior Operations Data Analyst
London, United Kingdom
Ali Agah is a Senior Operations Data Analyst. He got started with Tableau when he was looking for a job as a consultant in the data world and leveraged blogs, YouTube content, and connecting with members of the DataFam to learn Tableau. However, despite the breadth of resources available, Ali says that his favorite is Tableau Public because of the inspiring content that others share and because he is able to test his own skills through the platform. Being able to receive feedback and share his work has been instrumental in his learning development.
Community projects such as Makeover Monday and Workout Wednesday have been great sources of inspiration for the vizzes Ali publishes on Tableau Public. He appreciates being able to see the different ways that people approach creating vizzes with the same dataset and he enjoys being able to apply new learnings to the vizzes he creates.
Connect with Ali on Linkedin, X, and Tableau Public.
DataFam content
Dive into content created by the Tableau Community:
Kevin Flerlage: Do I Sort on "Field" or "Nested"
-
Nicole Lillian Mark: Meet the DataFam #10: Desiree Abbott
-
Tech Tips Girl: What Requirement Questions Should You Ask Your Clients?
-
Deepak Holla: Difference in the Drill-down behavior of Date Part and Date Value components of Date fields in Tableau
Team Tableau
Upcoming events and community participation
-
Lights, Camera, Action: Tableau and IMDb Launch Data Visualization Campaign for Movie Lovers
-
Free headshots at the Data + Women event at Tableau Conference 2024: Sunday, April 24, 2024 from 7:00pm-9:00pm at the San Diego Wine & Culinary Event Center. Register here!
Vizzes
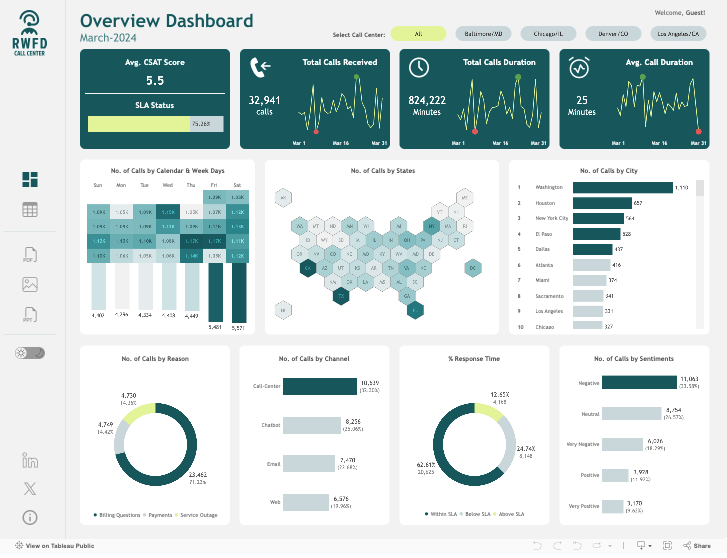
Waqar Ahmed Shaikh: Call Center Dashboard | RWFD
See the latest Viz of the Day, trending vizzes, featured authors, and more on Tableau Public.
Check out some inspirational vizzes created by the community:
-
Tamás Varga: The Life of Raw Materials in Amsterdam
-
Dennis Kao: How Many Vampires?
-
Jibril Mohamed: #DuboisChallenge2024 - Week 8: The Rise of the Negroes from Slavery to Freedom in One Generation
-
Shangruff Raina: RWFD - Hospitality Dashboard
-
Arshi Saleh: DVS Survey: Income Trends Among DataViz Professionals
Community Projects
Recreations of W.E.B Dubois's Data Portraits
Recreations of W.E.B Dubois's Data Portraits
Web: W.E.B. Dubois's Data Portraits
Twitter: #DubiosChallenge
Back 2 Viz Basics
A bi-weekly project helping those who are newer in the community and just starting out with Tableau. Not limited just to newbies!
Web: Back 2 Viz Basics
Twitter: #B2VB
Week 7: Build a Symbol Map
Workout Wednesday
Build your skills with a weekly challenge to re-create an interactive data visualization.
Web: Workout Wednesday
Twitter: #WOW2022
Week 14: Can you build a Trellis of Profit Ratio Gauges?
Preppin' Data
A weekly challenge to help you learn to prepare data and use Tableau Prep.
Web: Preppin’ Data
Twitter: #PreppinData
Week 14: Store Data
DataFam Con
A monthly challenge covering pop culture and fandoms.
Web: DataFam Con
Twitter: #DataFamCon
March 2024 Challenge: Sports Movies Edition
Makeover Monday
Create business dashboards using provided data sets for various industries and departments.
Web: Makeover Monday
Twitter: #MakeoverMonday
Week 14: Public Awareness Around Antibiotic Resistance
EduVizzers
A monthly project connecting real education data with real people.
Web: Eduvizzers
April 2024: School Bullying
Viz for Social Good
Volunteer to design data visualizations that help nonprofits harness the power of data for social change.
Web: Viz for Social Good
Twitter: #VizforSocialGood
March 15 - April 19, 2023: Visualizing the Social Impact of Viz for Social Good
Games Night Viz
A monthly project focusing on using data from your favorite games.
Web: Games Nights Viz
Twitter: #GamesNightViz
Season 2: With great power comes great vizzes
Iron Quest
Practice data sourcing, preparation, and visualization skills in a themed monthly challenge.
Web: Iron Quest
Twitter: #IronQuest
Women
Storytelling with Data
Practice data visualization and storytelling skills by participating in monthly challenges and exercises.
Web: Storytelling with Data
Twitter: #SWDChallenge
April 2024: Napoleon's April
Project Health Viz
Uncover new stories by visualizing healthcare data sets provided each month.
Web: Project Health Viz
Twitter: #ProjectHealthViz
October 2023: Customizing Shapes with Opacity in Tableau
Diversity in Data
An initiative centered around diversity, equity & awareness by visualizing provided datasets each month.
Web: Diversity in Data
Twitter: #DiversityinData
November 2023: Disney Demographics
Sports Viz Sunday
Create and share data visualizations using rich, sports-themed data sets in a monthly challenge.
Web: Sports Viz Sunday
Twitter: #SportsVizSunday
Real World Fake Data
Create business dashboards using provided data sets for various industries and departments.
Web: Real World Fake Data
Twitter: #RWFD
2024 - Admin Insights
Data Plus Music
A monthly project visualizing the data behind the music we love!
Web: Data Plus Music
Twitter: #DataPlusMusic
Zugehörige Storys

DataFam Roundup June 2026

DataFam Roundup May 2026

Iron Viz 2026: Read Between the Data
 28 Mai, 2026