How do you introduce kids with no data background into the data world? Here are three curated data activities—for all ages—to learn how to collect data, interpret graphs, and how to explore data to uncover insights.Alle Academic Storys
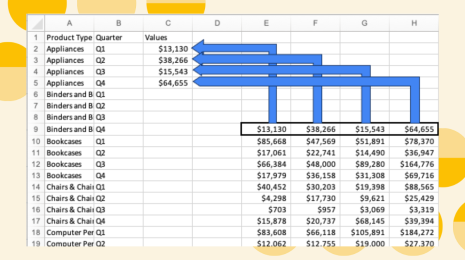
Learn the Basics of Well-Structured Data
 6 Dezember, 2024

What is Iron Viz: Student Edition?
 27 November, 2024

Tableau for Teaching: Free access and resources to teach Tableau
 3 November, 2024
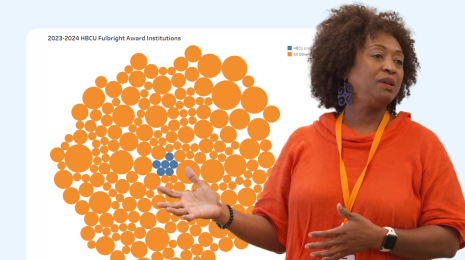
Fulbright Award Winner Closes Data Skills Gap for Students and Teachers
 25 Oktober, 2024

Student to BI Analyst, How Tableau Can Lead to a Successful Data Career
20 März, 2024
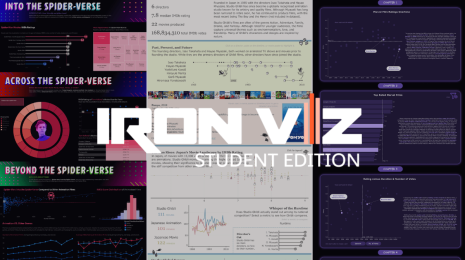
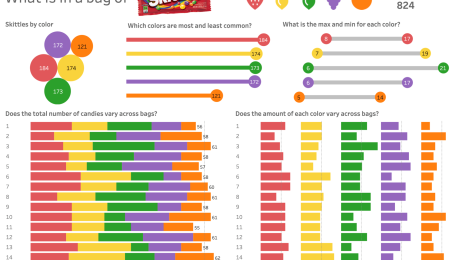
Top 3 Visualizations, Iron Viz: Student Edition 2024
13 Februar, 2024
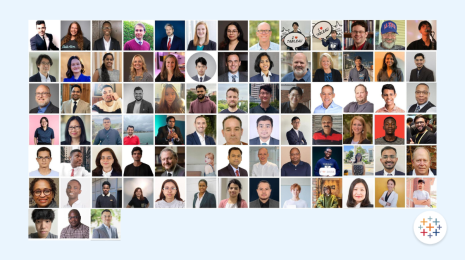
Who are the Tableau Academic Ambassadors?
19 September, 2023
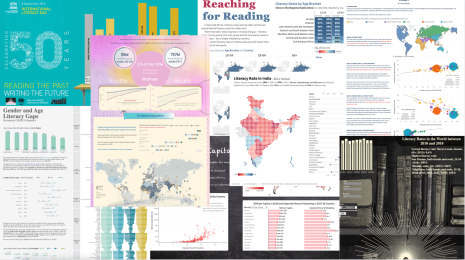
27 Data Visualizations to Gain Insight into Global Literacy
8 September, 2023
Students—Use These 3 Data Best Practices to Take Your Skills to the Next Level
 23 Dezember, 2022
3 Activities to Introduce Kids to the Fun World of Data

Building data skills and community with Tableau’s Academic Programs Lunch and Learn sessions
 20 April, 2022
You studied for grades, now viz for glory. Student Iron Viz 2021 is now open!
10 November, 2021
Data Skills
Follow these three data-structure tips to recognize the best, and smooth out the rest.
Academic
Learn more about Tableau’s student-only data visualization competition—Iron Viz: Student Edition.
Academic
Learn how to get started with free Tableau for educators—including curriculum and training resources to grow data skills for students.
Community Profiles
Dr. Mary Dunaway shares her career journey and how working with Tableau has helped her teach data skills to a broader audience.
Tableau Community
This student harnessed the power of Tableau Public for data learning and networking to get her first job in business intelligence.
Iron Viz
Learn about the top 3 visualizations, winners, and judging for Iron Viz: Student Edition 2024 —Tableau’s annual data visualization competition just for students.
Tableau Ambassadors
Learn about the Tableau Academic Ambassadors and how these students and educators showcase the power of Tableau to new data learners.
Tableau Public
Learn about the complexities and nuances of literacy rates around the world through this gallery of visualizations created in Tableau Public.
Tableau's Senior Curriculum Strategy Manager, Sue Kraemer, helps break down data best practices to help guide you through your data visualization process.
Data Kids
15 Dezember, 2022
Academic
With more instructors bringing data skills into their classroom, the Tableau Academic Programs team wanted to create a space for sharing, learning, and building community.
Academic
Submissions for Iron Viz: Student Edition are now open from November 10 - December 31, 2021! Find out the theme and how to enter.