Check out the Best of the Tableau Web from August to learn how to create joy plots, manage server installations, and much more.Alle Storys
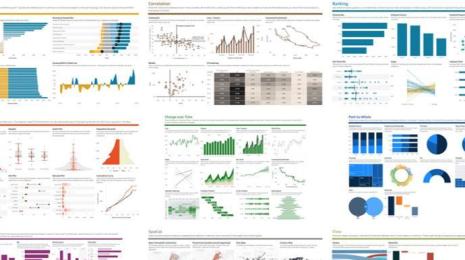
What I learned from recreating the Financial Times’ Visual Vocabulary in Tableau
 27 September, 2018


USDA enabling data-driven decision making with Tableau


Drei gängige falsche Vorstellungen über das Machine Learning
 20 September, 2018

Data literacy : A critical skill for the 21st century
 19 September, 2018


Manage Tableau Mobile deployments with Citrix Endpoint Management and Microsoft Intune

Best of the Tableau Web: Creating joy plots, managing server installations, and more
 11 September, 2018

Teamwork is dreamwork when working with artificial intelligence
7 September, 2018
Neu in Tableau Prep: Automatische Ermittlung von Problemen der Datenqualität mithilfe von Datenrollen
 6 September, 2018

