Welcome to Andy Cotgreave's August review of the best blogs and podcasts shared by the Tableau community! This month, Andy highlights a couple of excellent places you can start in order to develop your skills.Alle Storys


Explain Data liefert interaktive Erklärungen für ein besseres Datenverständnis
 19 September, 2019

Heute verfügbar: Erklär die Daten, Tableau Catalog und Tableau Server Management-Add-on
 17 September, 2019

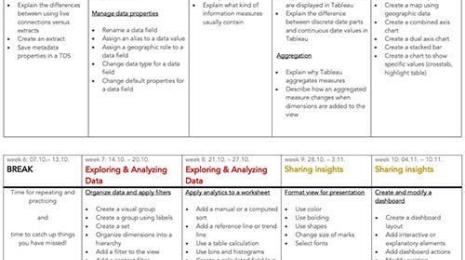
Best of the Tableau Web: Developing your Tableau skills
 17 September, 2019

Become Certifiably Tableau at TC19
 16 September, 2019

Arbeiten Sie mit dem Tableau Server Management Add-on in noch größerem Maßstab
 13 September, 2019

These companies used Tableau + Snowflake for flexibility and scale, a winning combination
 13 September, 2019

84 Iron Viz entries visualize migration data from The Associated Press
 12 September, 2019

3 storytelling with color tips to improve your data visualization
 12 September, 2019

Tips and tricks for filtering your data with Tableau Prep Builder
 10 September, 2019
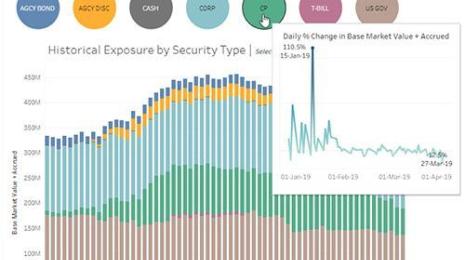
Answer your investment questions faster with Tableau
 9 September, 2019
Product
Vorhang auf für Explain Data – eine neue KI-gestützte Funktion, die Ihnen dabei hilft, das „Warum“ hinter unerwarteten Werten zu verstehen.
Product
Tableau 2019.3 ist da! Mit dieser Version helfen wir Ihnen, Ihre Daten besser zu verstehen und Vertrauen dazu aufzubauen. Wir machen es einfacher, als datengesteuertes Unternehmen zu wachsen und Tableau noch umfassender zu nutzen.

Best of Tableau Web
Data Skills
In this post, we’ll share the benefits of getting Tableau certified, some expert tips and tricks for passing your exam, and more details about getting certified at TC19. Let’s dive in!
Product
Das Server Management Add-on vereint erweiterte Plattformfunktionen in den Bereichen Sicherheit, Skalierbarkeit und Verwaltbarkeit. Es wurde für IT-Administratoren entwickelt, die zur Unterstützung ihrer Bereitstellung spezifischere technische Anforderungen haben.
Tableau Cloud
At the Snowflake Summit, we learned how a few of our customers are combining the scalability and flexibility of Snowflake’s cloud data warehouse with the powerful visual analytics capabilities of Tableau.
Tableau Public
Visualizations
Color is one of the easiest ways to control the style of your data visualization. A good use of color makes visuals more engaging, makes insights pop off the view, and adds some professional polish. Learn to use color in your visualizations to communicate your narrative.
Data
When cleaning your data, you often need to filter out values you don’t need. In this blog post, Maraki Ketema shares tips and tricks for quick filtering in Tableau Prep Builder—like one-click filtering, multi-select filtering, filtering a range of values, and more.
Enterprise
Tableau uses Clearwater Analytics to automate the process of aggregating its investment data. Learn to improve how you manage investments, while increasing trust that your business’s portfolio is being managed judiciously.