Introducing TabMon, a cluster monitor for Tableau Server


At Tableau, our mission is to help people see and understand data, including data from Tableau services—a process we call “using Tableau on Tableau.” In the spirit of self-service, we are proud to announce the release of TabMon, our open source cluster monitor for Tableau Server.
You can use TabMon to monitor physical (CPU, RAM), network, and hard-disk usage. You can track cache-hit ratio, request latency, active sessions, and much more.
TabMon records system health and application metrics out of the box. It collects built-in metrics like Windows Perfmon, Java Health, and Java Mbean (JMX) counters on Tableau Server machines across a network. It displays the data in a clean, unified structure, making it easy to visualize the data in Tableau Desktop.
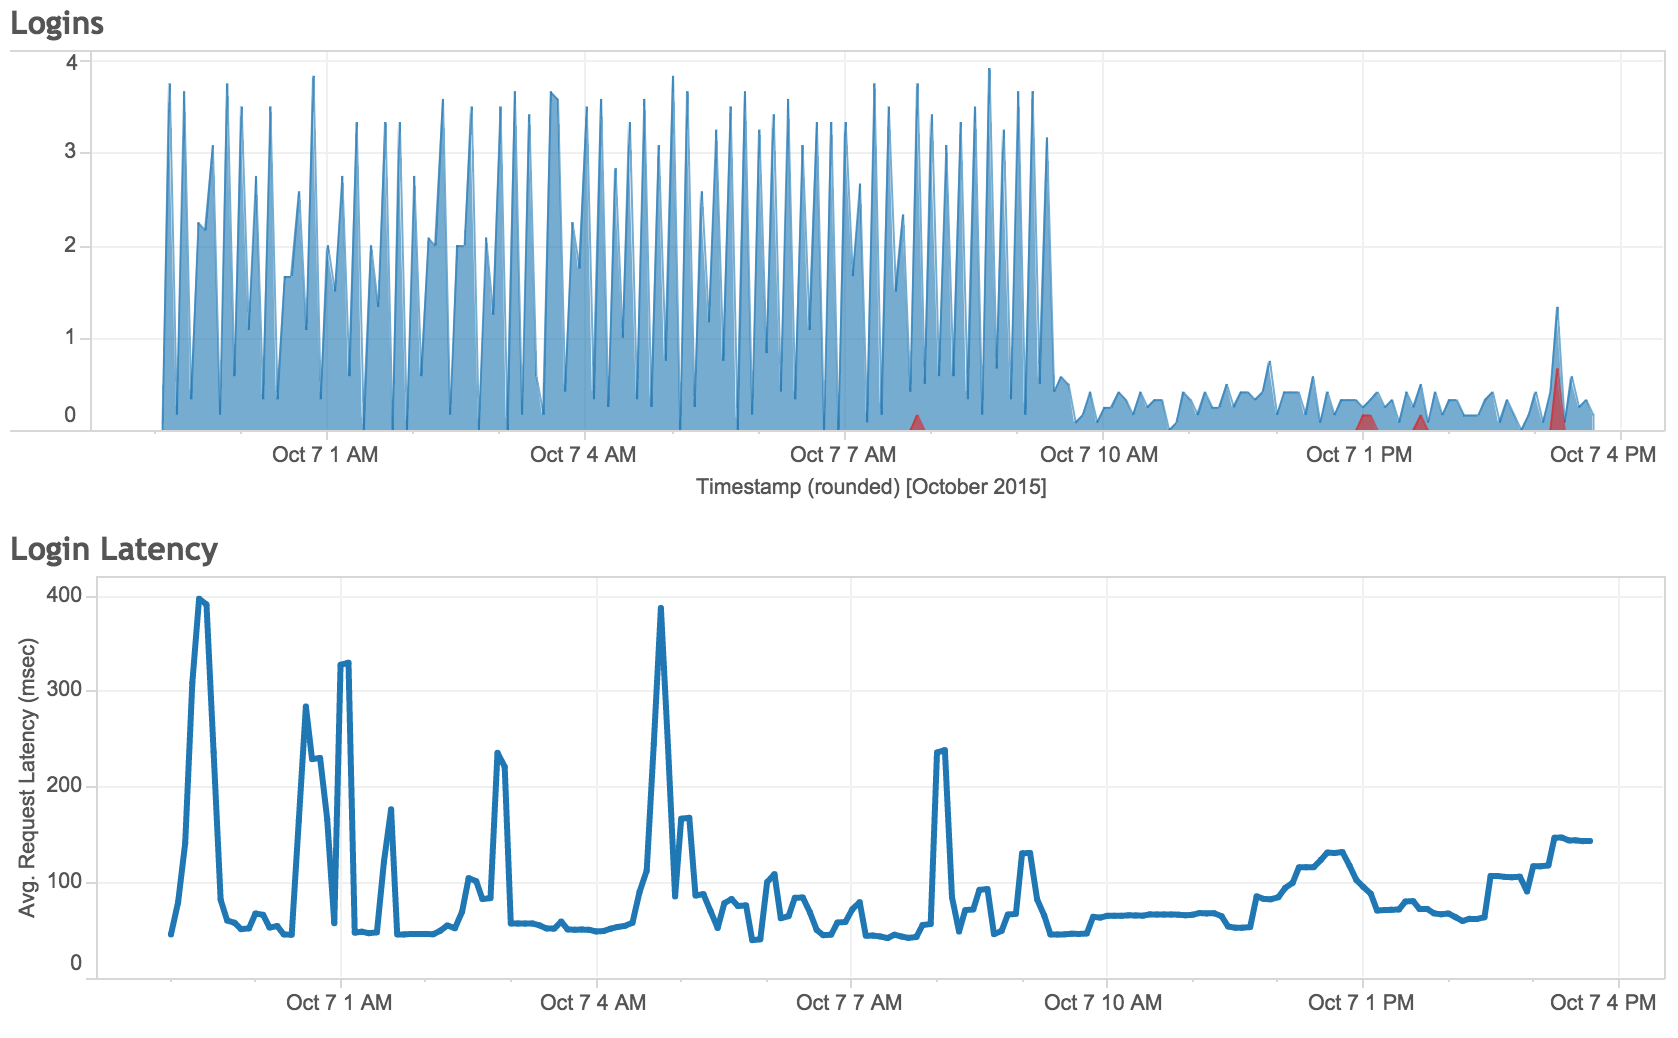
TabMon gives you full control over which metrics to collect and which machines to monitor, no scripting or coding required. All you need to know is the machine and the metric name. TabMon can run both remotely and independently of your cluster. You can monitor, aggregate, and analyze the health of your cluster(s) from any computer on your network with almost no added load to your production machines.
TabMon is community-supported, and we are releasing the full source code under the MIT open source license. We hope you'll add your own contributions to this tool. We are excited to see where you take it.
Download TabMon, read our installation guide, and visit the Tableau Server Admin Community page to join the discussion. You can also download the source on the TabMon GitHub page.
Zugehörige Storys
How EMD Serono is improving patient care with personalized, AI-powered insights from Tableau
 30 September, 2024

Embedded Analytics: Should you build or buy?
 7 Juni, 2022

Data fabric’s value to the enterprise
 11 Mai, 2022