Monitor your Google Cloud cost and usage
No matter where you are in your cloud journey — freshly migrated or a cloud veteran — we understand there are several needs that remain consistent and pressing for IT to minimize risks and maximize your investments in the cloud. As part of Tableau’s ongoing partnership with Google Cloud, we have invested in providing IT departments and stakeholders with a solution to help manage your Google Cloud costs. This solution is relevant not only for customers deploying Tableau Server on Google Cloud, but if anyone that relies on any Google Cloud services — compute power, databases, IoT, machine learning, and beyond.
Google Cloud generates extensive data while tracking the activities in your Google Cloud environment and the costs associated with them. We’ve created a workflow to connect directly to this valuable data from Tableau. From there, Tableau’s rich analytic capabilities allow you to investigate this data in great detail and communicate that information across your organization to help drive key business decisions. These dashboards we’ve developed are a starting place for your Google Cloud analysis, but can be customized and tuned to your requirements.
 |
 |
|
Google Cloud Monitoring Dashboards
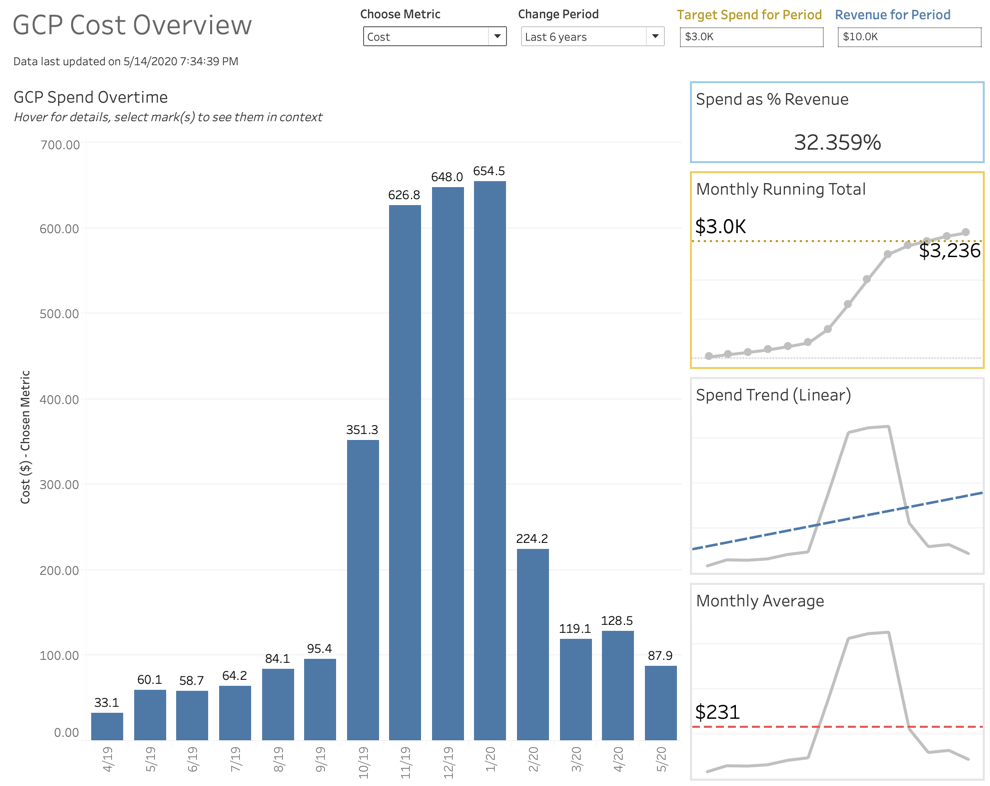
All the dashboard starters have the option of looking at absolute cost, or the cost including credits applied to the usage. The GCP Cost Overview give you a visual representation of how your costs are trending over time. At a glance you can understand current spend for the month, last months spend, and the views on the right provide more information about cost trends. We see some of our customers combining this data with other datasets that include company revenue to prove ROI as well as targets for a given period to make sure that spending is controlled. Combining these datasets could be as easy as adding a connection to the existing data source, or could be a more involved data project that would require Tableau Prep.
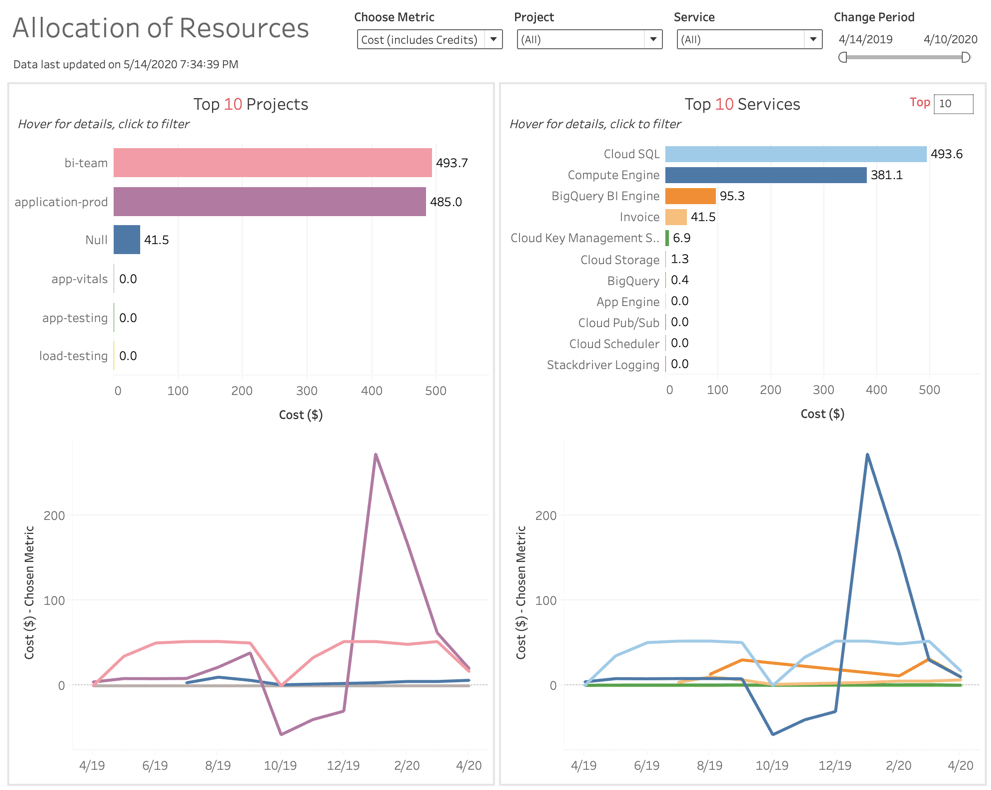
For more exploratory analysis, we built the Allocation of Resources dashboard to understand which projects and services are driving up costs. The highly interactive dashboard allows you to click and filter down to activities that you’re curious about. For project owners, this dashboard offers you insight into which services are costing you the most and how you compare to other projects.
Which services cost the most? How does it compare to usage? Are there usage patterns I can learn from? The Service Tracking dashboard was designed to investigate those questions. Drill into the SKU level of detail and explore your spending all the way down to the hour level.
![]()
Getting Started: How to set up Google cost reports in Tableau
Included below are instructions on how to set up cost reporting, including a downloadable sample workbook.
Part one: Load GCP billing data to Google BigQuery
To load your GCP billing data in Google Bigquery (GBQ) you can follow these instructions provided by Google. The process takes no more than 15 minutes. A few important things to note:
- Cost data is not retroactive, so it will take time to populate the table - see Frequency of Data Loads () in Google documentation.
- If you have multiple billing accounts this process will have to be repeated.
- The initial set up only take a few minutes - but it may take several hours for the first data to be loaded into your new billing dataset.
- Within the instructions, you’ll also find a table that includes a description of every field loaded into GBQ.
Part two: Download GCP Cost Monitoring Dashboards
Download and open the GCP Cost Monitoring dashboards. You will need Tableau Desktop (version 2019.1 or greater) to open this file. If you have not downloaded Tableau Desktop before, you can start a trial here.
Part three: Connect your data to the dashboard
Once you've downloaded the workbooks, add your new GBQ data source, and switch it with the dummy dataset.
- Open the .twbx file you just downloaded (see part 2).
- Connect to Google BigQuery and select the Billing Project, Project, and Dataset where the table you created in part 1 lives.
- Instead of dragging out the table, double click on ‘New Custom SQL’ option under Table and copy and paste the Custom SQL below. Make sure you fill out the FROM clause with your information to point to the correct billing table.
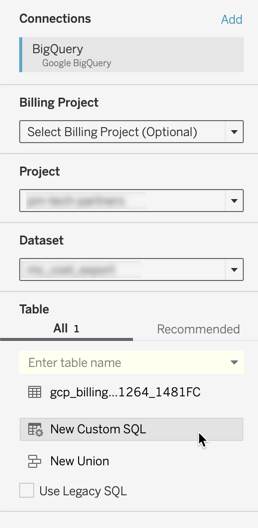
- Replace the sample data source with the live connection from Google BigQuery.
- Click through the dashboards to load the new data.
Custom SQL (copy and paste)
SELECT billing_account_id AS billing_account_id, usage_start_time AS usage_start_time, usage_end_time AS usage_end_time, export_time AS export_time, cost AS cost, currency AS currency, currency_conversion_rate AS currency_conversion_rate, cost_type AS cost_type, service.id AS service_id, service.description AS service_description, sku.id AS sku_id, sku.description AS sku_description, project.id AS project_id, project.name AS project_name, project.ancestry_numbers AS project_ancestry_numbers, location.location AS location_location, location.country AS location_country, location.region AS location_region, location.zone AS location_zone, usage.amount AS usage_amount, usage.unit AS usage_unit, usage.amount_in_pricing_units AS usage_amount_in_pricing_units, usage.pricing_unit AS usage_pricing_unit, invoice.month AS invoice_month, (SELECT SUM(c.amount), FROM UNNEST(credits) c) AS credit_amount, FROM
Things to keep in mind
- If your dashboards are not displaying any data, make sure that the filters reset (double check your date filters).
- If you'd like to create an extract of your GCP data, you man encounter an error because of the nested fields in the data source. To avoid this, hide the following fields before taking the extract: 'Credits.Name', 'Labels,Key', 'Labels.Value', 'Project.Labels.Key', 'Project.Labels.Value', 'System Labels.Key', 'System Lables.Value', 'Credits.Amount'
Get the most out of the dashboards with Tableau Server
- Use custom views to quickly filter to a particular project or service that you want to monitor.
- Set up data-driven alerts on views to receive a notification if costs have risen too high.
- Set subscriptions for a snapshot of the most recent data in your inbox.
- Create metrics on fields that you want to easily track and have readily available to you.