What is Tableau’s Iron Viz?


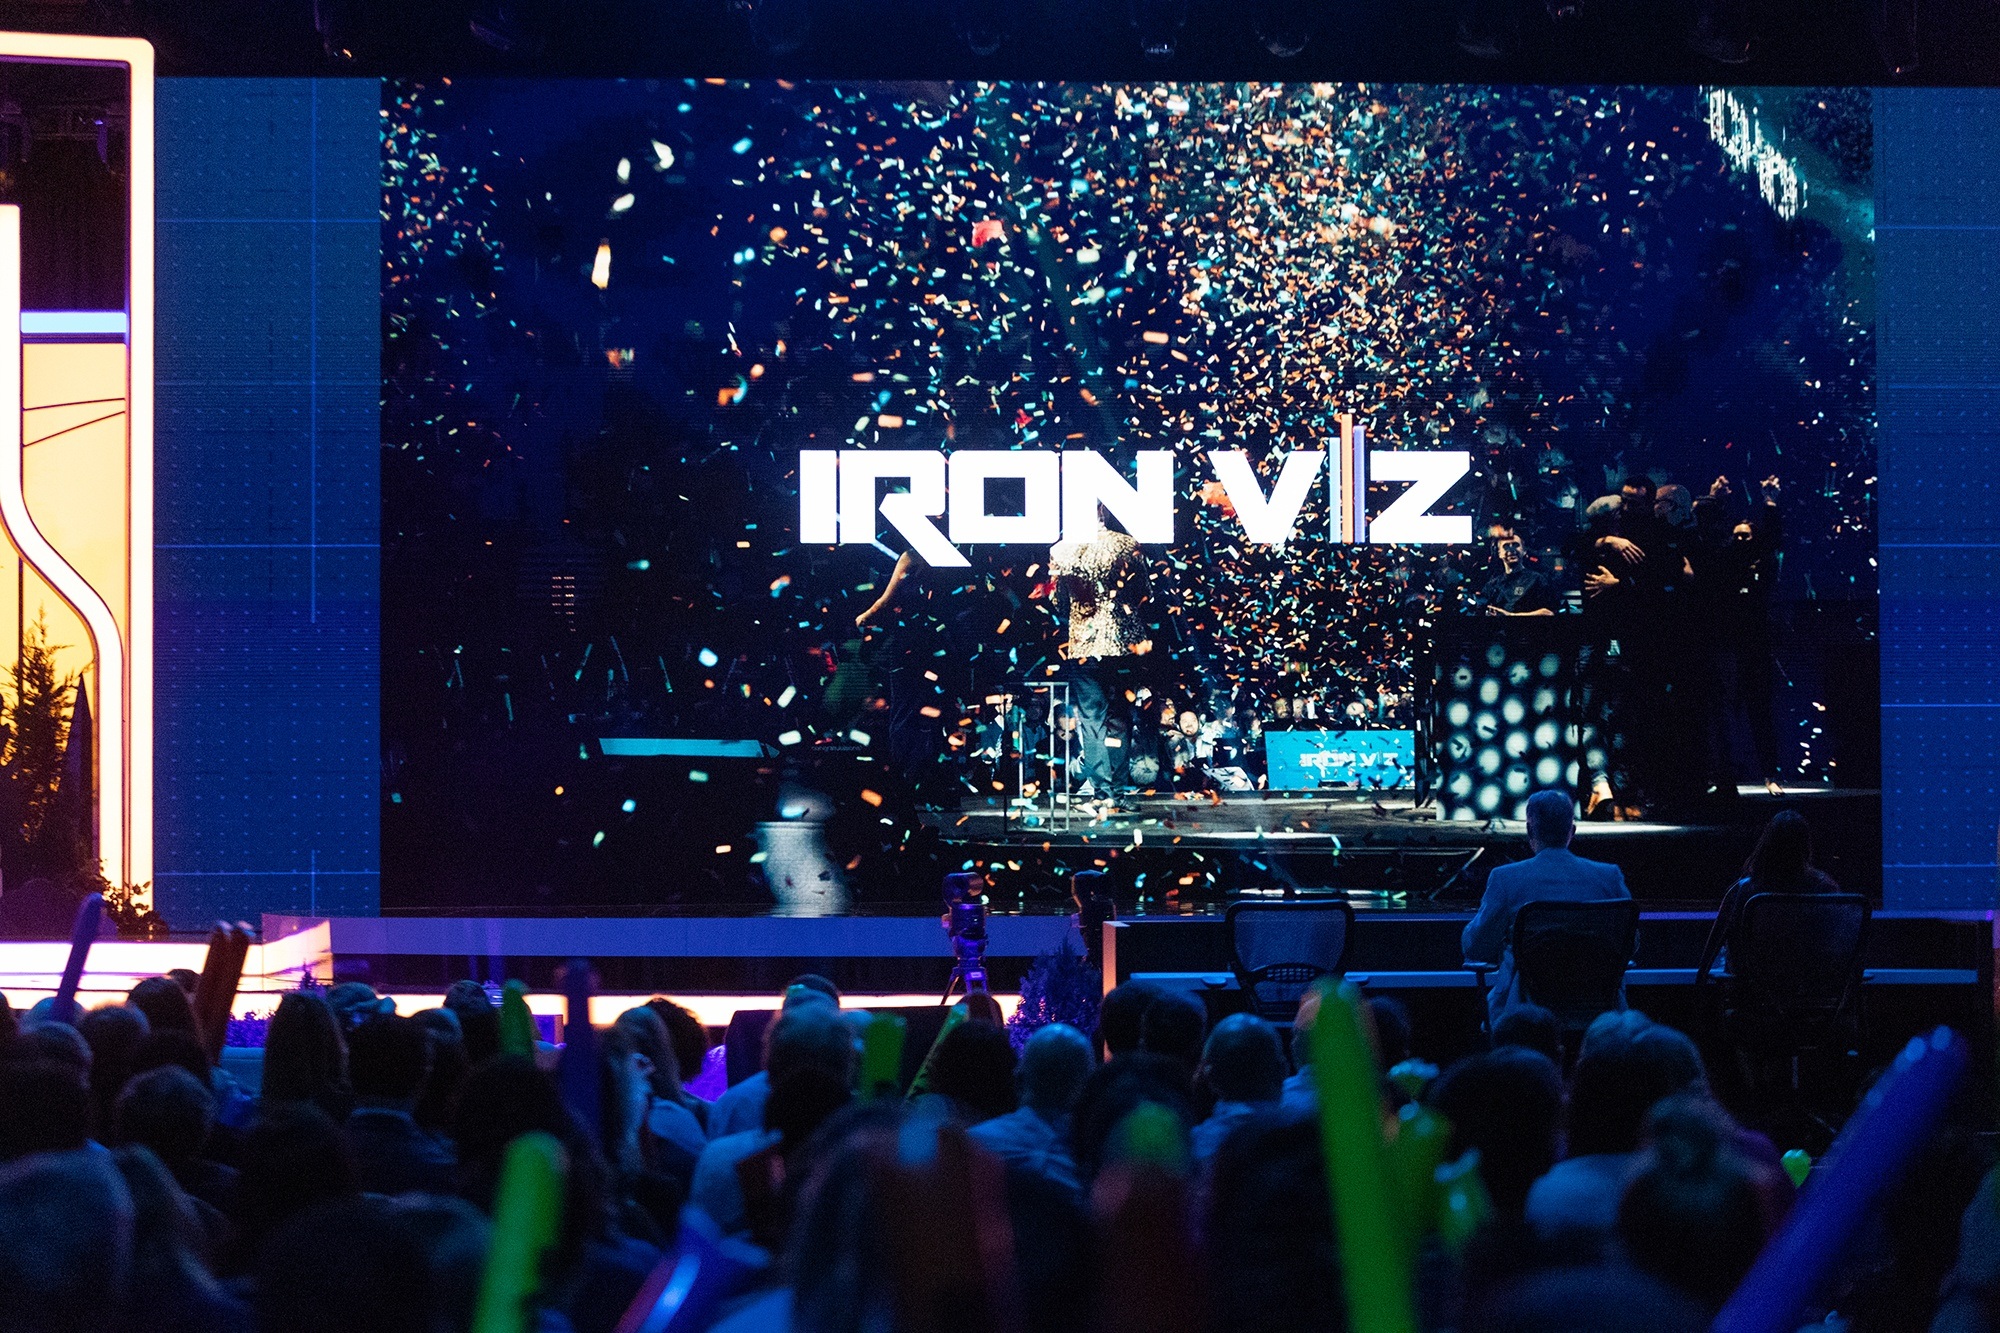
Iron Viz, the world's largest data visualization competition, is held on the keynote stage at Tableau Conference.
Iron Viz is the world’s largest data visualization competition, where every year, three contestants take center stage in front of a global audience and deliver a compelling and awe-inspiring story visualizing the same data set in 20 minutes.
The beginning of Iron Viz
Based on the world-renowned Iron Chef cooking show, Iron Viz started as a Tableau Conference 2011 breakout session with 300 people in attendance. More than a decade later, Iron Viz has become a highly-anticipated event with thousands in attendance at Tableau Conference.
Who participates in Iron Viz?
People of all skill levels can be a part of Iron Viz. From entering the qualifier to providing participant feedback to being a spectator, it’s for all data enthusiasts worldwide. And you are guaranteed to gain new skills and inspiration throughout the process.
The top ten Iron Viz qualifier entries from 2024. Explore the visualizations here.
Global qualifier contest
The three finalists are selected from a global qualifier competition. Each qualifier is centered around a different theme, and contestants are required to source their own data. The topics are intentionally broad and open to interpretation. Previous feeder topics include art, sports, environmental subjects, and music. In the beginning, there were three qualifiers held per year, with one winner selected from each proceeding to the finals. Now there is one global qualifier per year, with the top three highest-scoring entries gaining the chance to reign supreme. The criteria in which our judges narrow down the best of the best include:
- Design – How appropriate is the design for the story being told?
- Storytelling – Is there a clear story being told or a question being explored, and is there appropriate context?
- Analysis – How sophisticated and appropriate is the data that is being used for the story?
Data sets and themes
The championship data sets have covered a range of topics, from weather to movies to food-focused themes. The data sets are complex, consisting of millions of rows along with countless ways to analyze and tell a story with them. The three contenders are given the data sets ahead of time, allowing them to practice their build before the live event. The amount of skill needed to extract the meaning behind these complex data points goes beyond masterful, as the types of visualizations built under these nail-biting conditions are not only mind-blowing but provide a learning opportunity for everyone involved.
Sous Vizzers
The Iron Viz contestants are not alone in their journey. Each has a personal sous vizzer—not unlike a sous chef—to support them in the weeks leading up to the main event and when they take the stage. Sous Vizzers are Tableau employees hand-selected based on their expert data visualization skills, attention to detail, and location to the finalists. They provide feedback and guidance on best practices, design, and storytelling. They also share how-to resources, troubleshooting tips, and encouragement. Sous Vizzers are the contenders’ fiercest cheerleader, championing them until the final vote is cast.
Where contenders build and showcase their data stories
Iron Viz dashboards are powered by Tableau Public. Tableau Public launched in 2010 with the purpose of making data social and to ignite a new movement on the web. It was a bold new effort to offer a free online platform that anyone could use to explore, create and publicly share data visualizations, and drive compelling conversations around data—making data online fun, useful, and beautiful. Thirteen years later, Tableau Public is the backbone of Iron Viz. Its 3+ million authors are continuing that revolution of democratizing data and changing the way people see and understand data globally, one gorgeous visualization at a time.
Who decides the winner?
When the finalists take the keynote stage, the formidable contenders need to impress a global audience as well as a world-class panel of visualization savvy leaders composed of two Tableau employees and the previous year’s Iron Viz Champion. The judging is again based on three criteria: design, analysis, and storytelling.
What is the reward for winning Iron Viz?
Anyone who enters Iron Viz gets the chance to build their Tableau Public portfolio, learn something new, get inspired, and take their data skills to the next level. The finalists are recognized on a global stage and earn the humble-bragging rights that come with qualifying for the world’s largest data visualization contest. The winner receives a $15,000 cash prize and $10,000 towards a non-profit of their choice. If you ask us, everyone that participates—including the audience—wins. Trust us when we tell you it is something you must see to truly understand.
Watch and learn about the world's largest data viz competition, Iron Viz.
Learn more
- Stay up to date with Iron Viz throughout the year
- Join the #IronViz conversation on social media
- Watch past competitions
เรื่องราวที่เกี่ยวข้อง

DataFam Roundup June 2026

DataFam Roundup May 2026

Iron Viz 2026: Read Between the Data
 May 28, 2026