DataFam Roundup: October 2–6, 2023


Welcome! Dig into this week's DataFam Roundup—a weekly blog that brings together community content all in one post. As always, we invite you to send us your content—and the DataFam content from your peers that have inspired you! Find the content submission form here.
Community Highlight
To recognize new and consistent Tableau contributors—we’re excited to have a section within the weekly DataFam Roundup called the Tableau Community Highlight. Find out how to get involved.

Ayoade Abel Adegbite, Consultant Data Analyst, Tutor
Lagos, Nigeria
Ayoade Abel Adegbite is a Consultant Data Analyst and tutor. He leverages Tableau to create effective storytelling, trend identification, and decision-making for his clients and students. Ayoade is part of the Ibadan Tableau User Group, is active on Tableau Public and the Tableau Forums, and has his own YouTube channel.
The wealth of knowledge that comes from the Tableau Community, and specifically Tableau User Groups, has been an important part of Ayoade’s learning journey. Engaging with User Groups has allowed him to expand his perspective on the diverse applications of Tableau and further his own insights. Ayoade created a local TUG in Nigeria earlier this year, the Ibadan User Group, which welcomed over 75 Tableau users at their inaugural meeting in August.
In addition to his involvement in the Tableau Community, Ayoade also has his own YouTube channel. He creates content for aspiring data analysts, students, professionals, and anyone interested in learning about data analysis. He was inspired to begin his channel because of his own passion for data visualization, the desire to provide educational content beyond traditional settings, the opportunity to address specific learning needs, and the goal to engage with a global community interested in data analysis and Tableau.
Connect with Ayoade on Linkedin, X, Tableau Public, and on his YouTube channel.
DataFam content
Dive into content created by the Tableau Community:
-
Jonathan Fowler, The Data Leadership Collaborative: 5 Ethical Principles of Data Collection
-
Sarah Bartlett, infogr8: Sarah Bartlett on Design Thinking in Data Viz: Why Understanding the User is Key to Success
-
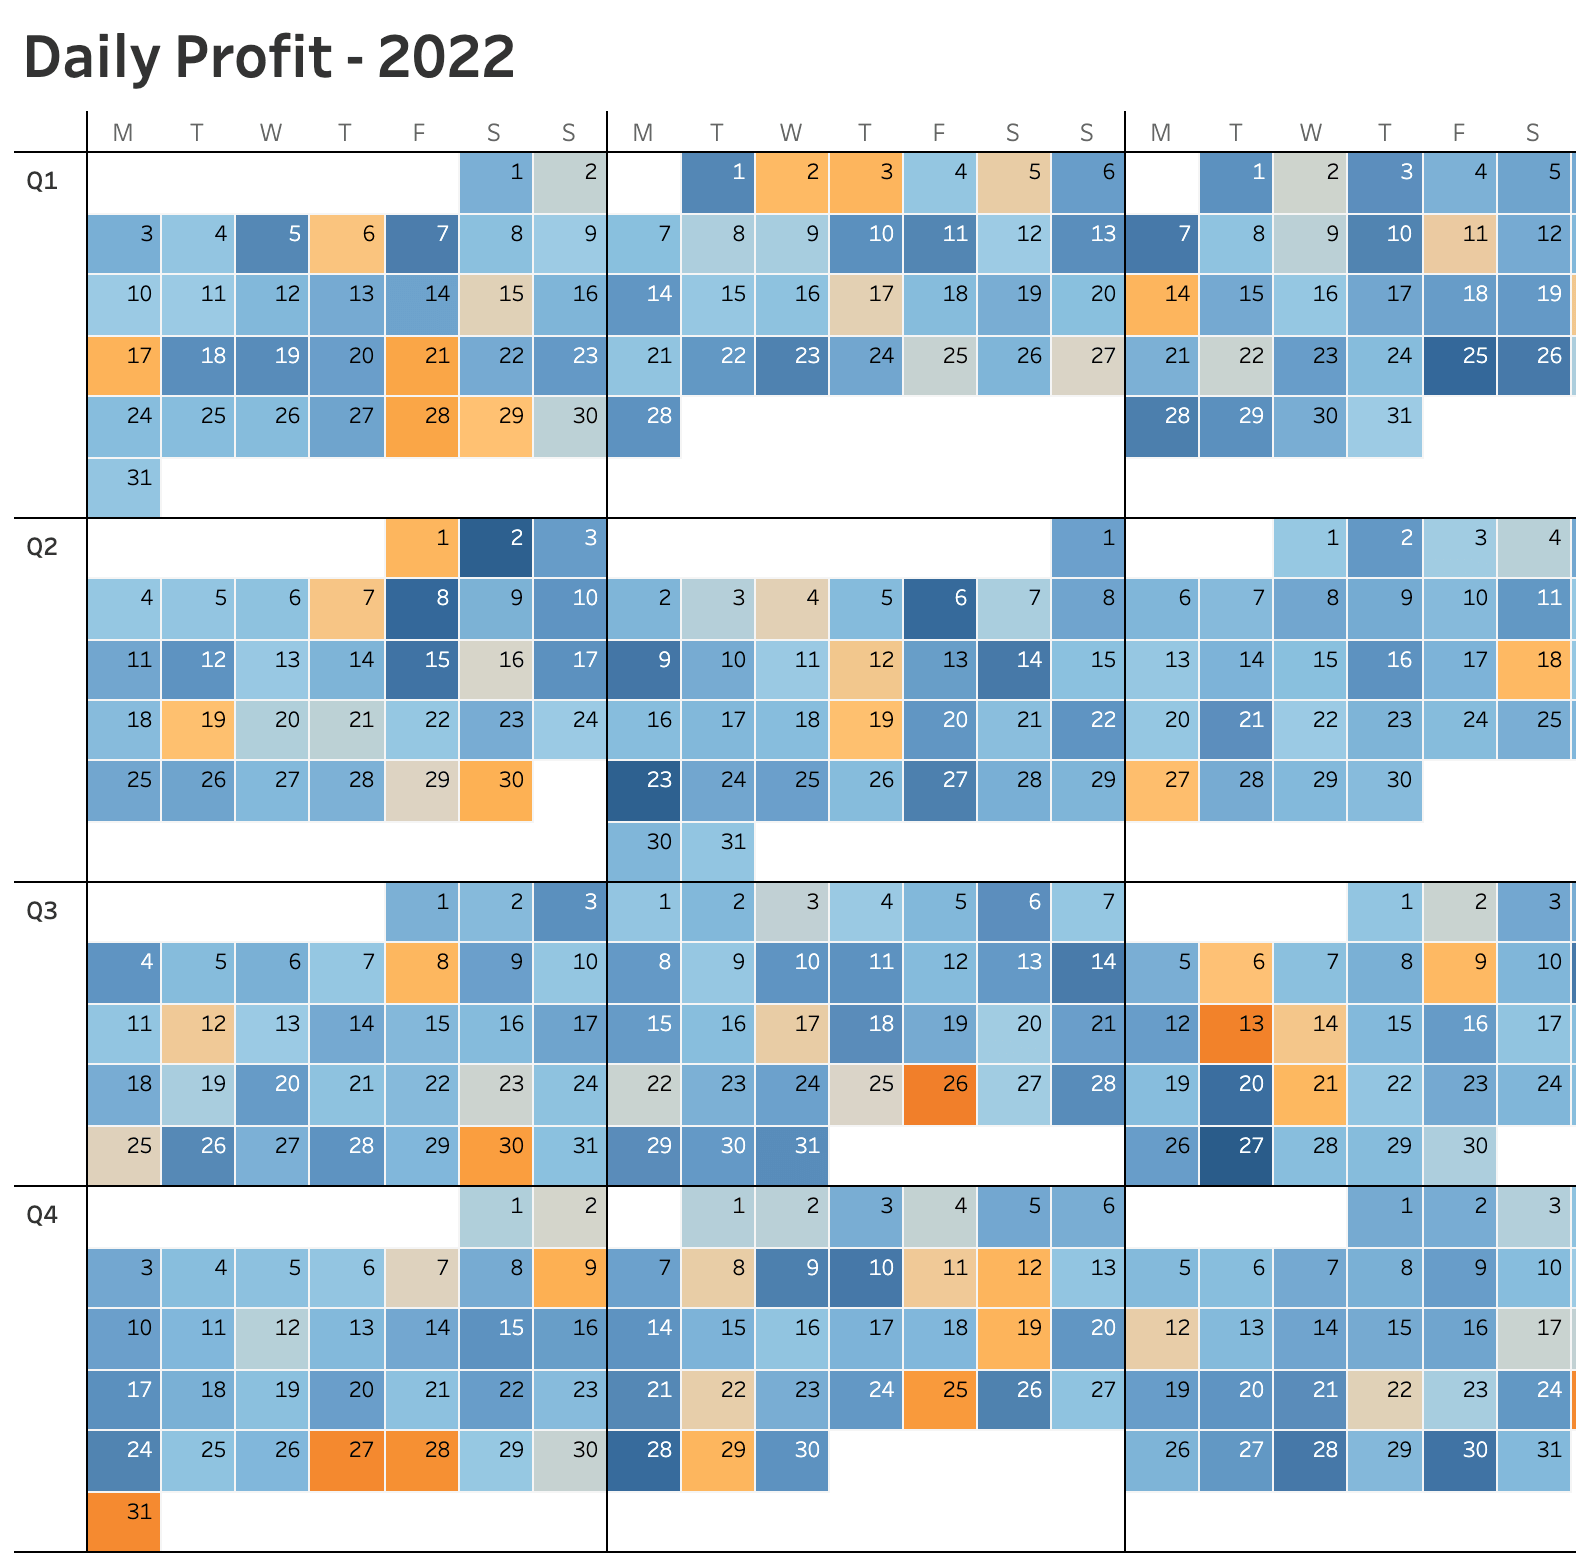
Andy Kriebel, VizWiz: Master Dynamic Zone Visibility in Tableau: Yearly to Monthly Calendar Drill Down
-
Ansula Jain, Techi Anshi: Tableau Dashboard Performance Recording
-
Lindsay Betzendahl, Viz Zen Data: Customizing Shapes with Opacity in Tableau
-
Brittany Rosenau: 10 (not so tiny) Iron Viz Tips
-
Data+Love = Gaming, Community, and Passion Projects with Louis Yu
-
Steve Wexler: More thoughts on visualizing uncertainty in survey data - Data Revelations
-
Tristan Guillevin, LinkedIn: Convert your Figma design to a fully functional Tableau dashboard
-
Emily Padua: Reasons to Enter Iron Viz
-
Venkatesh lyer, PhData: How to Build a Hierarchy Filter in Tableau
Team Tableau
Upcoming events and community participation
-
Get Started with Tableau Public for Data Visualization [Online]: 2023-10-04: You will leave this workshop with an understanding of how to:
-
connect datasets to your Tableau workbook;
-
create a variety of basic chart types (including bar charts, line graphs, and maps);
-
publish and share interactive charts and graphs.
-
-
Demystifying the way to learn Data Visualization! Are you looking for a way to learn Data Visualization and feeling lost? We all have been there and I am going to help you understand the fundamentals and look for a way to learn data visualization.
-
Career Pathmakers: This is the launch event for the Career PathMakers user group. This group will be focused on helping its members navigate challenges in their careers, both with a mentorship program and a transition support program.
-
Viz Collab is back: Hello everyone! I’m excited to be opening #VizCollab back up for another round of matches! In the last year I matched around 40 people for some amazing vizzes, including Viz of the Days and a viz that was featured in a local publication. So if you want to find a collaboration partner sign up.
-
Local Community Conferences by the DataFam, for the DataFam.
Vizzes
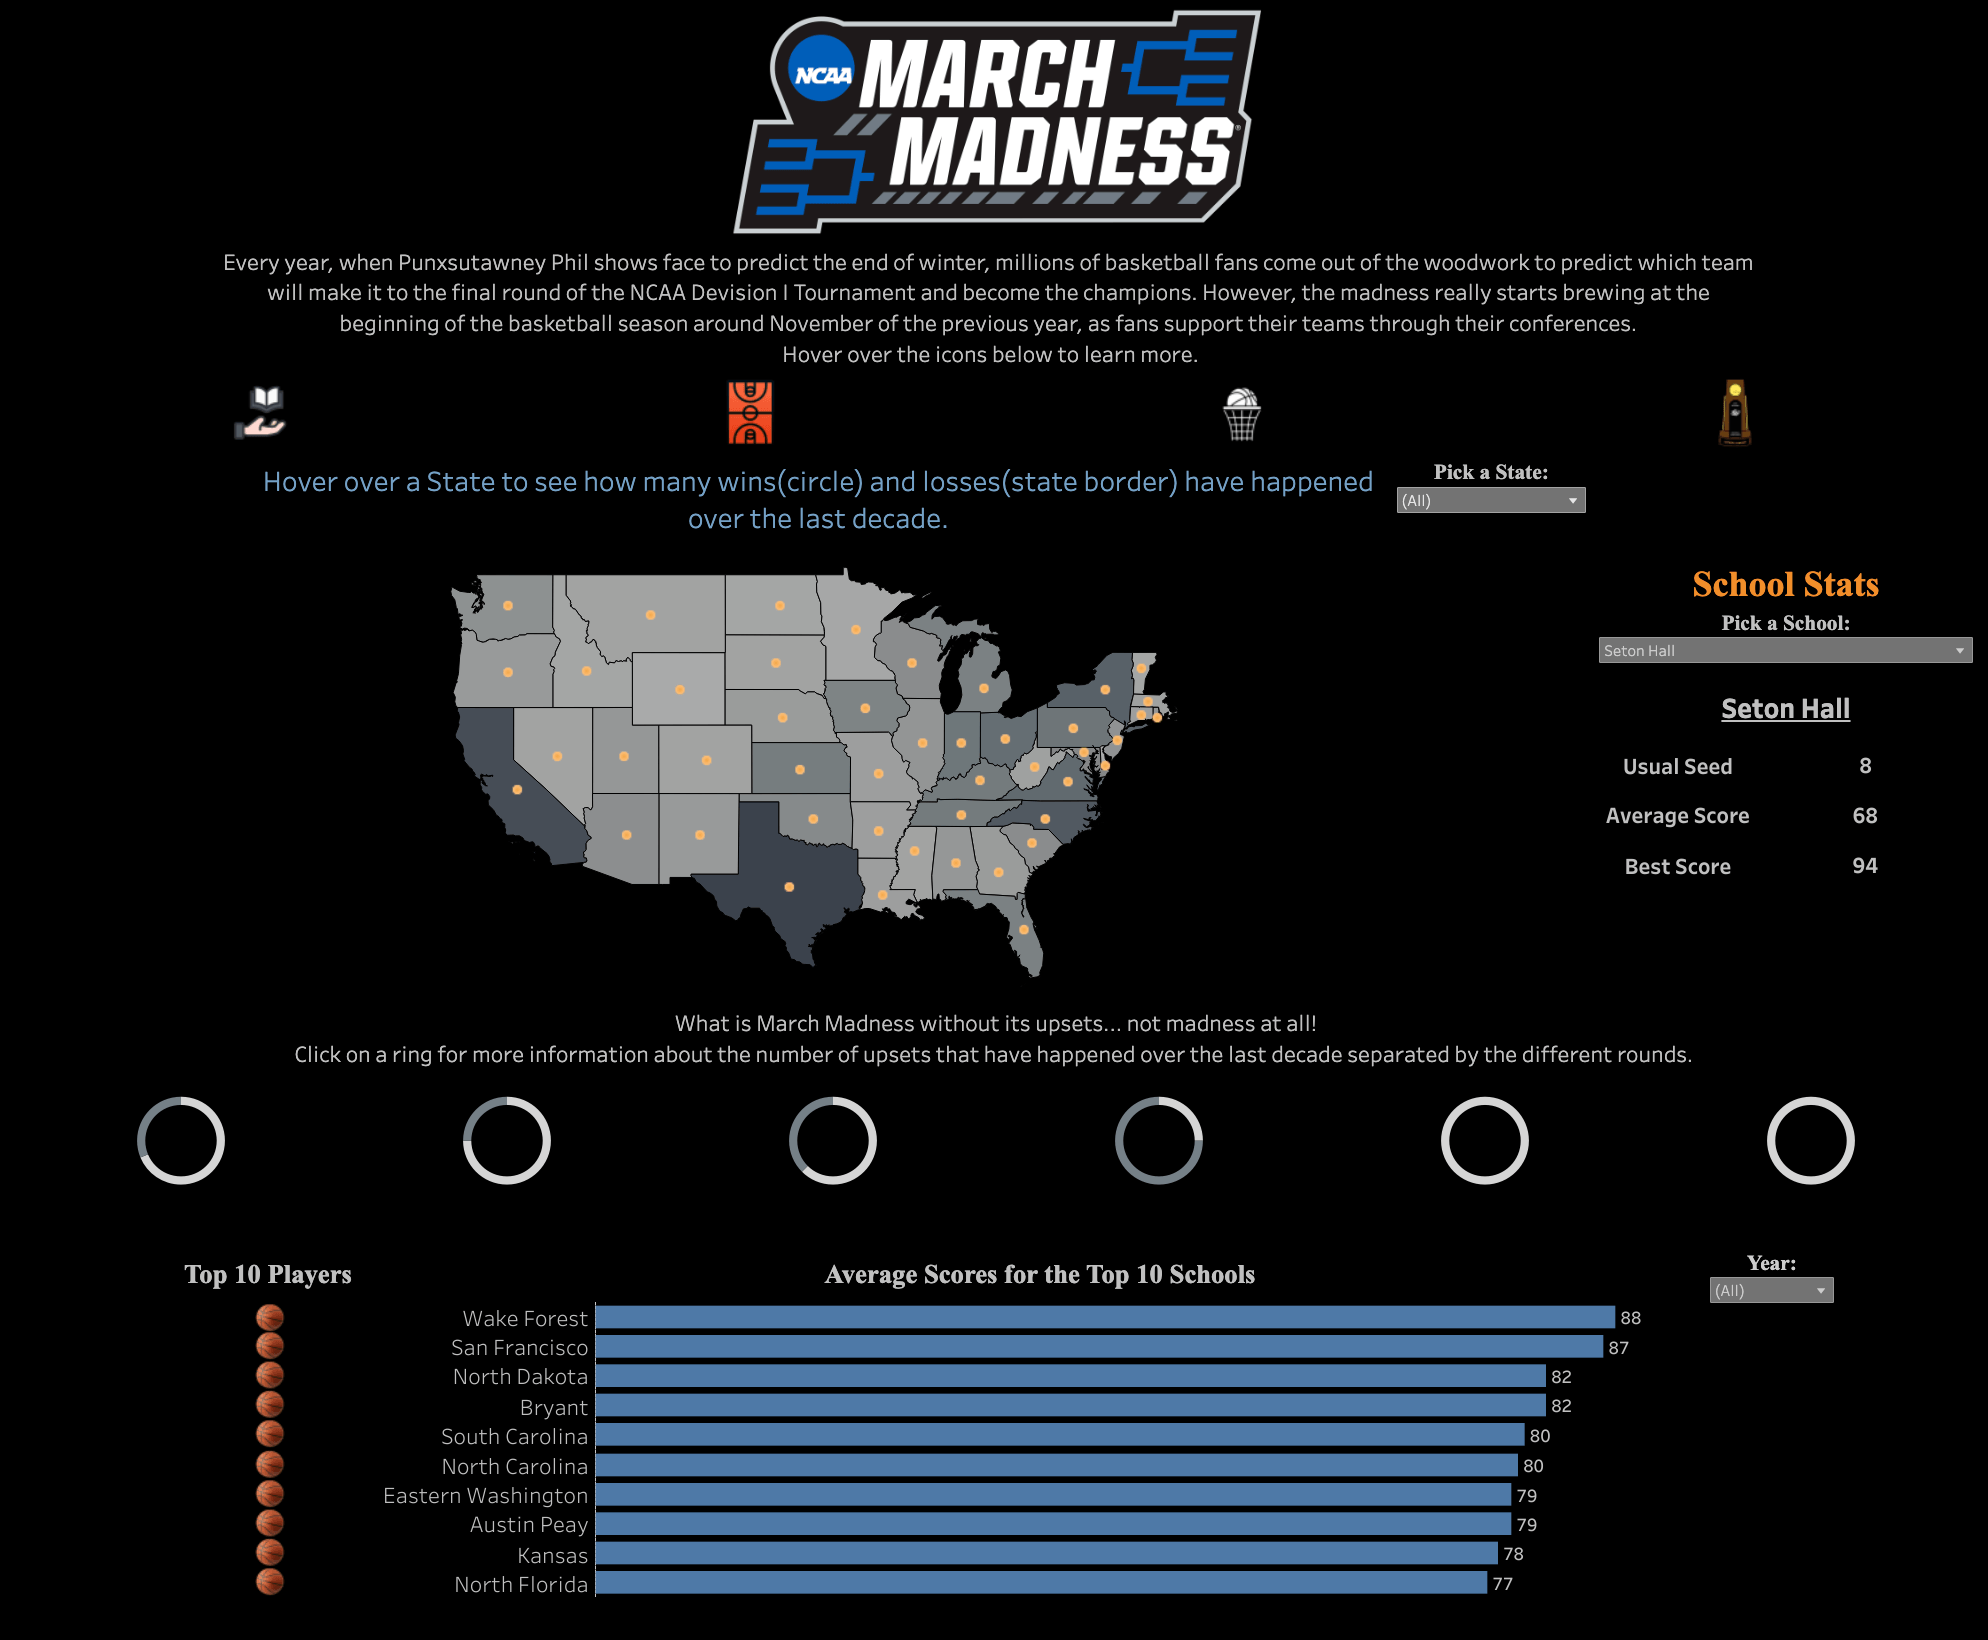
Lorraine Ferrusi: MarchMadness 2.0
See the latest Viz of the Day, trending vizzes, featured authors, and more on Tableau Public.
Check out some inspirational vizzes created by the community:
-
Lorraine Ferrusi: MarchMadness 2.0
-
Preethi Lodha: America's International Students Trends and Impacts #ChartChamp
-
Maureen Okonkwo: US Eviction Rate Across 34 Cities
Community Projects
Back 2 Viz Basics
A bi-weekly project helping those who are newer in the community and just starting out with Tableau. Not limited just to newbies!
Web: Back 2 Viz Basics
Twitter: #B2VB
Week 19: Your Chart Choice
Workout Wednesday
Build your skills with a weekly challenge to re-create an interactive data visualization.
Web: Workout Wednesday
Twitter: #WOW2022
Week 40: Let’s Analyze New Product Sales
Makeover Monday
A weekly social data project.
Web: Makeover Monday
Twitter: #MakeoverMonday
Week 40: Scary Dream Trends
Preppin' Data
A weekly challenge to help you learn to prepare data and use Tableau Prep.
Web: Preppin’ Data
Twitter: #PreppinData
Week 40: Prep School Subject Dropouts
DataFam Con
A monthly challenge covering pop culture and fandoms.
Web: DataFam Con
Twitter: #DataFamCon
September 2023: Barbie World!
EduVizzers
A monthly project connecting real education data with real people.
Web: Eduvizzers
September 2023: School Book Bans in the United States
Games Night Viz
A monthly project focusing on using data from your favorite games.
Web: Games Nights Viz
Twitter: #GamesNightViz
Season 2: Battle of the Strongest
Iron Quest
Practice data sourcing, preparation, and visualization skills in a themed monthly challenge.
Web: Iron Quest
Twitter: #IronQuest
White Space
Storytelling with Data
Practice data visualization and storytelling skills by participating in monthly challenges and exercises.
Web: Storytelling with Data
Twitter: #SWDChallenge
September 2023: makeover magic
Project Health Viz
Uncover new stories by visualizing healthcare data sets provided each month.
Web: Project Health Viz
Twitter: #ProjectHealthViz
June 2023: Funding for Research for Various Conditions and Diseases
Diversity in Data
An initiative centered around diversity, equity & awareness by visualizing provided datasets each month.
Web: Diversity in Data
Twitter: #DiversityinData
May 2023: Mental Health Awareness Month and LGBTQ+ Representation in film
Sports Viz Sunday
Create and share data visualizations using rich, sports-themed data sets in a monthly challenge.
Web: Sports Viz Sunday
Twitter: #SportsVizSunday
Viz for Social Good
Volunteer to design data visualizations that help nonprofits harness the power of data for social change.
Web: Viz for Social Good
Twitter: #VizforSocialGood
Real World Fake Data
Create business dashboards using provided data sets for various industries and departments.
Web: Real World Fake Data
Twitter: #RWFD
Session 5: Diversity Score Card
Data Plus Music
A monthly project visualizing the data behind the music we love!
Web: Data Plus Music
Twitter: #DataPlusMusic
Relaterade berättelser

DataFam Roundup June 2026

DataFam Roundup May 2026

Iron Viz 2026: Read Between the Data
 28 Maj, 2026