26 Tableau Features to Know from A to Z


Whether you're a novice data analyst exploring the possibilities of Tableau or a leader with years of experience using VizQL to gain advanced insights—this is your list of key Tableau features you should know, from A to Z. Get a quick look at tools and techniques of this dynamic data visualization platform, and uncover tips, tricks, and strategies that will propel how you work with data to create impactful visualizations and make informed decisions.
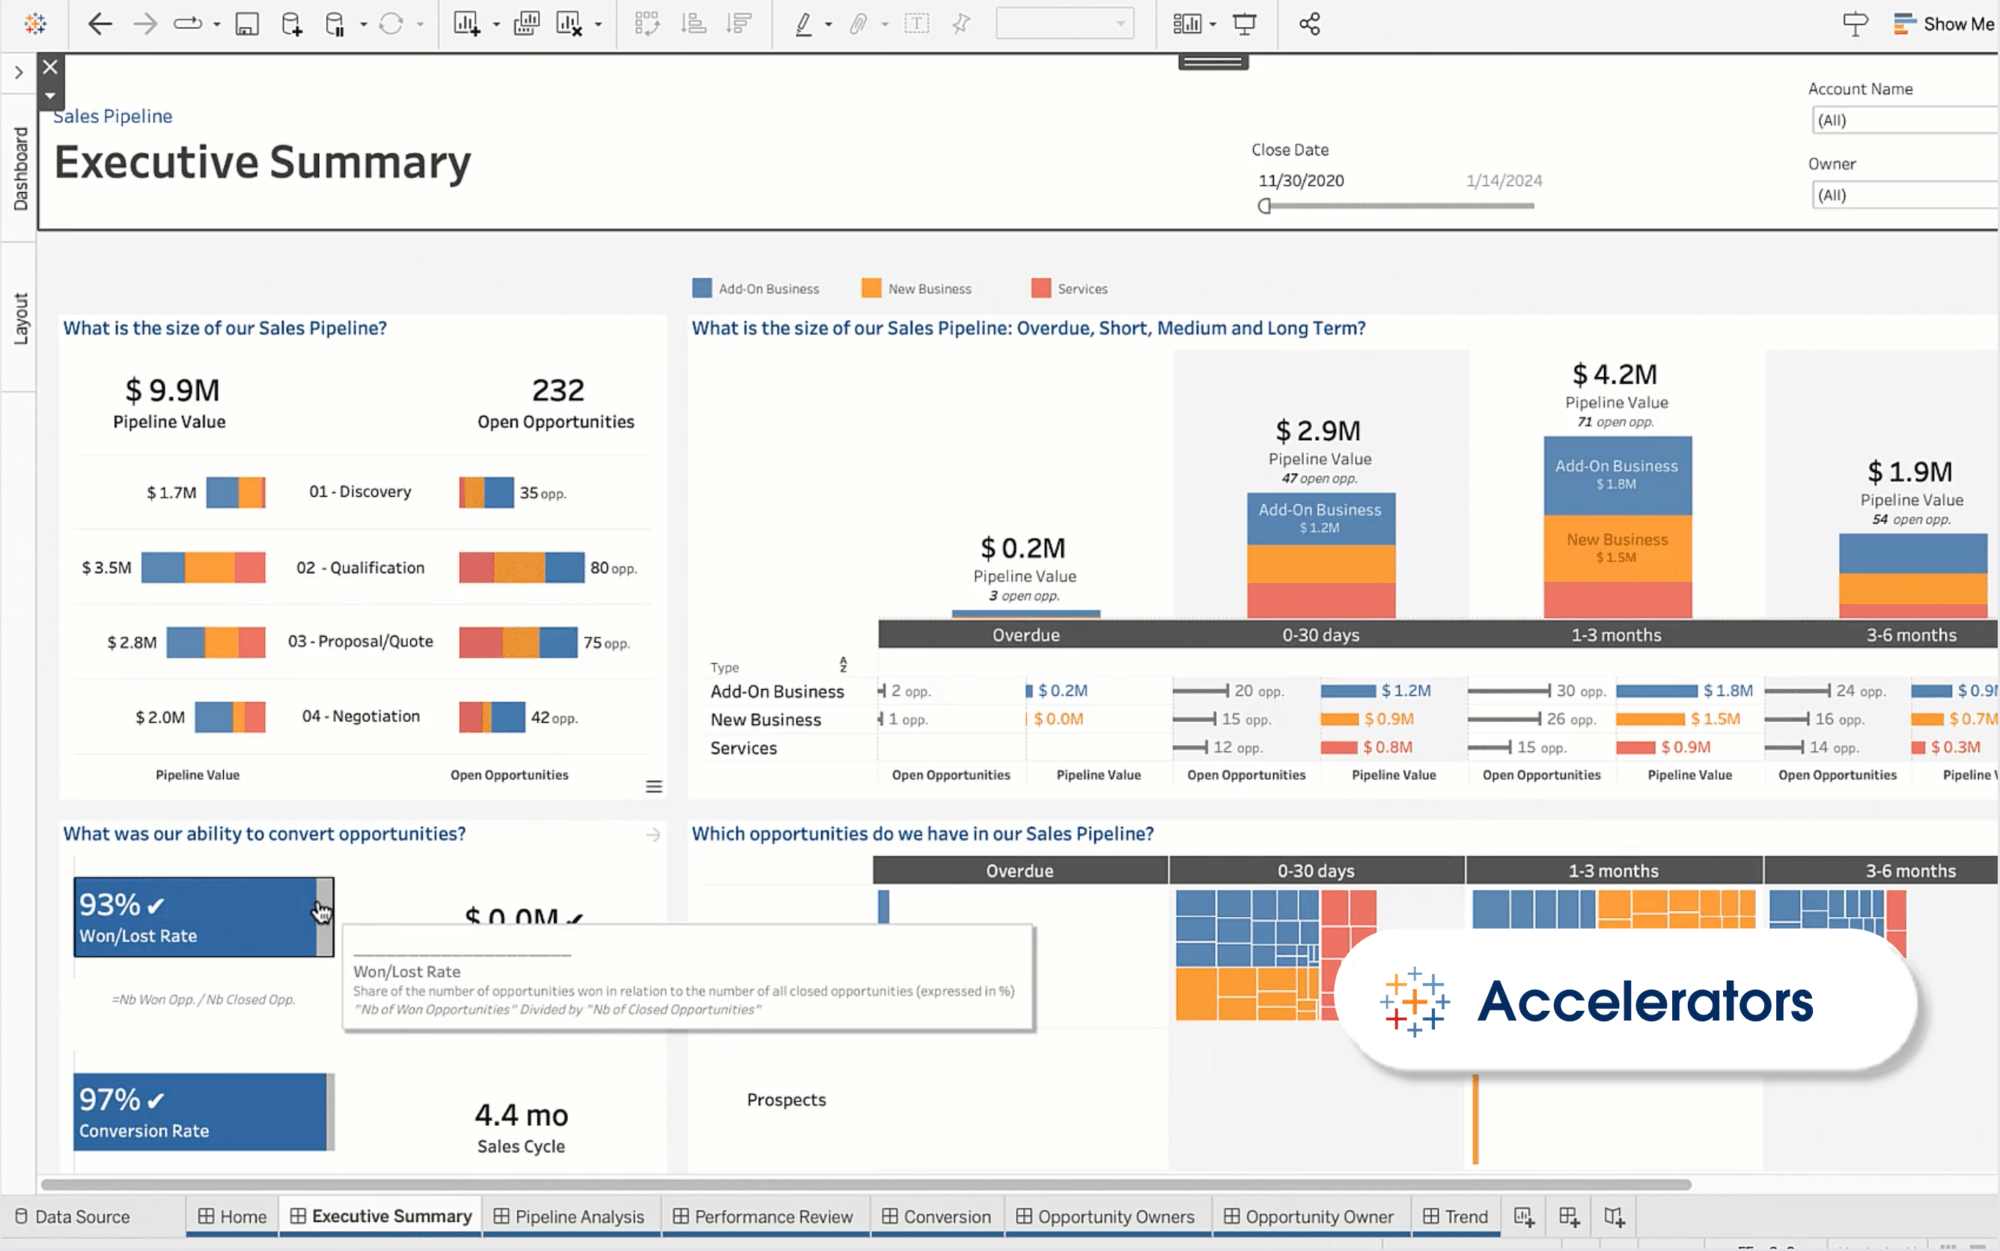
Accelerator
Instant access to the best analytic solutions
Tableau Accelerators are ready-to-use dashboards that you can combine with your data and customize to fit your needs to help you get to data-driven insights faster. They allow you to accelerate time to value with ready-to-use and fully customizable dashboards for your unique use case, regardless of industry, department, or function. You can leverage our best practices to address 100+ use cases today. And that's not all; you can also expand and extend accelerators with your own data sets and partner solutions.
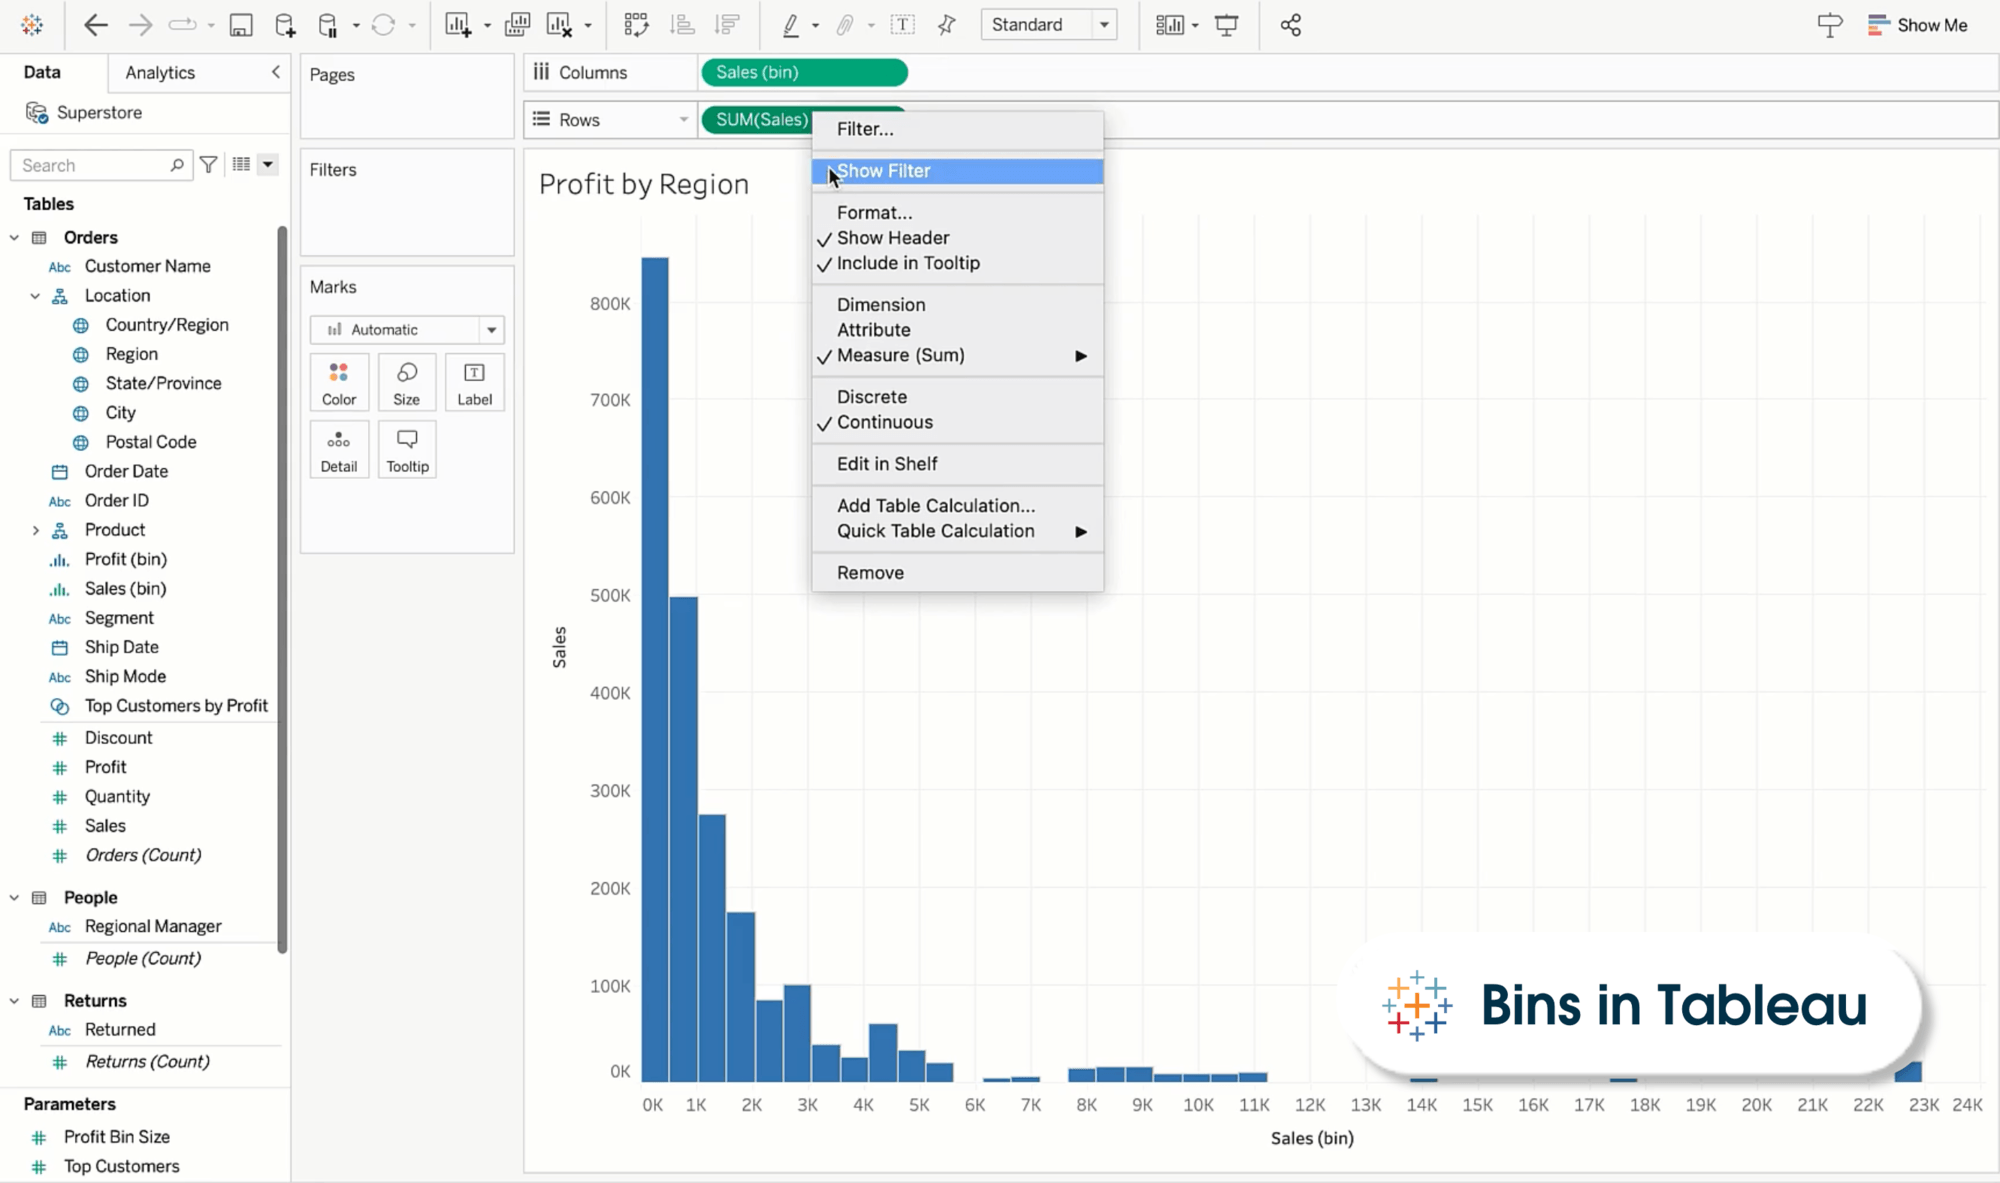
Bins
Easily group data points to simplify analysis
Bins in Tableau group continuous data into discrete intervals, making it easier for you to visualize and analyze data through histograms and other distribution displays. They help transform complex datasets into easily interpretable patterns so you can intuitively create continuous measure groupings without writing lengthy IF statements. You can create histograms from binned dimensions to quickly see the distribution of data.
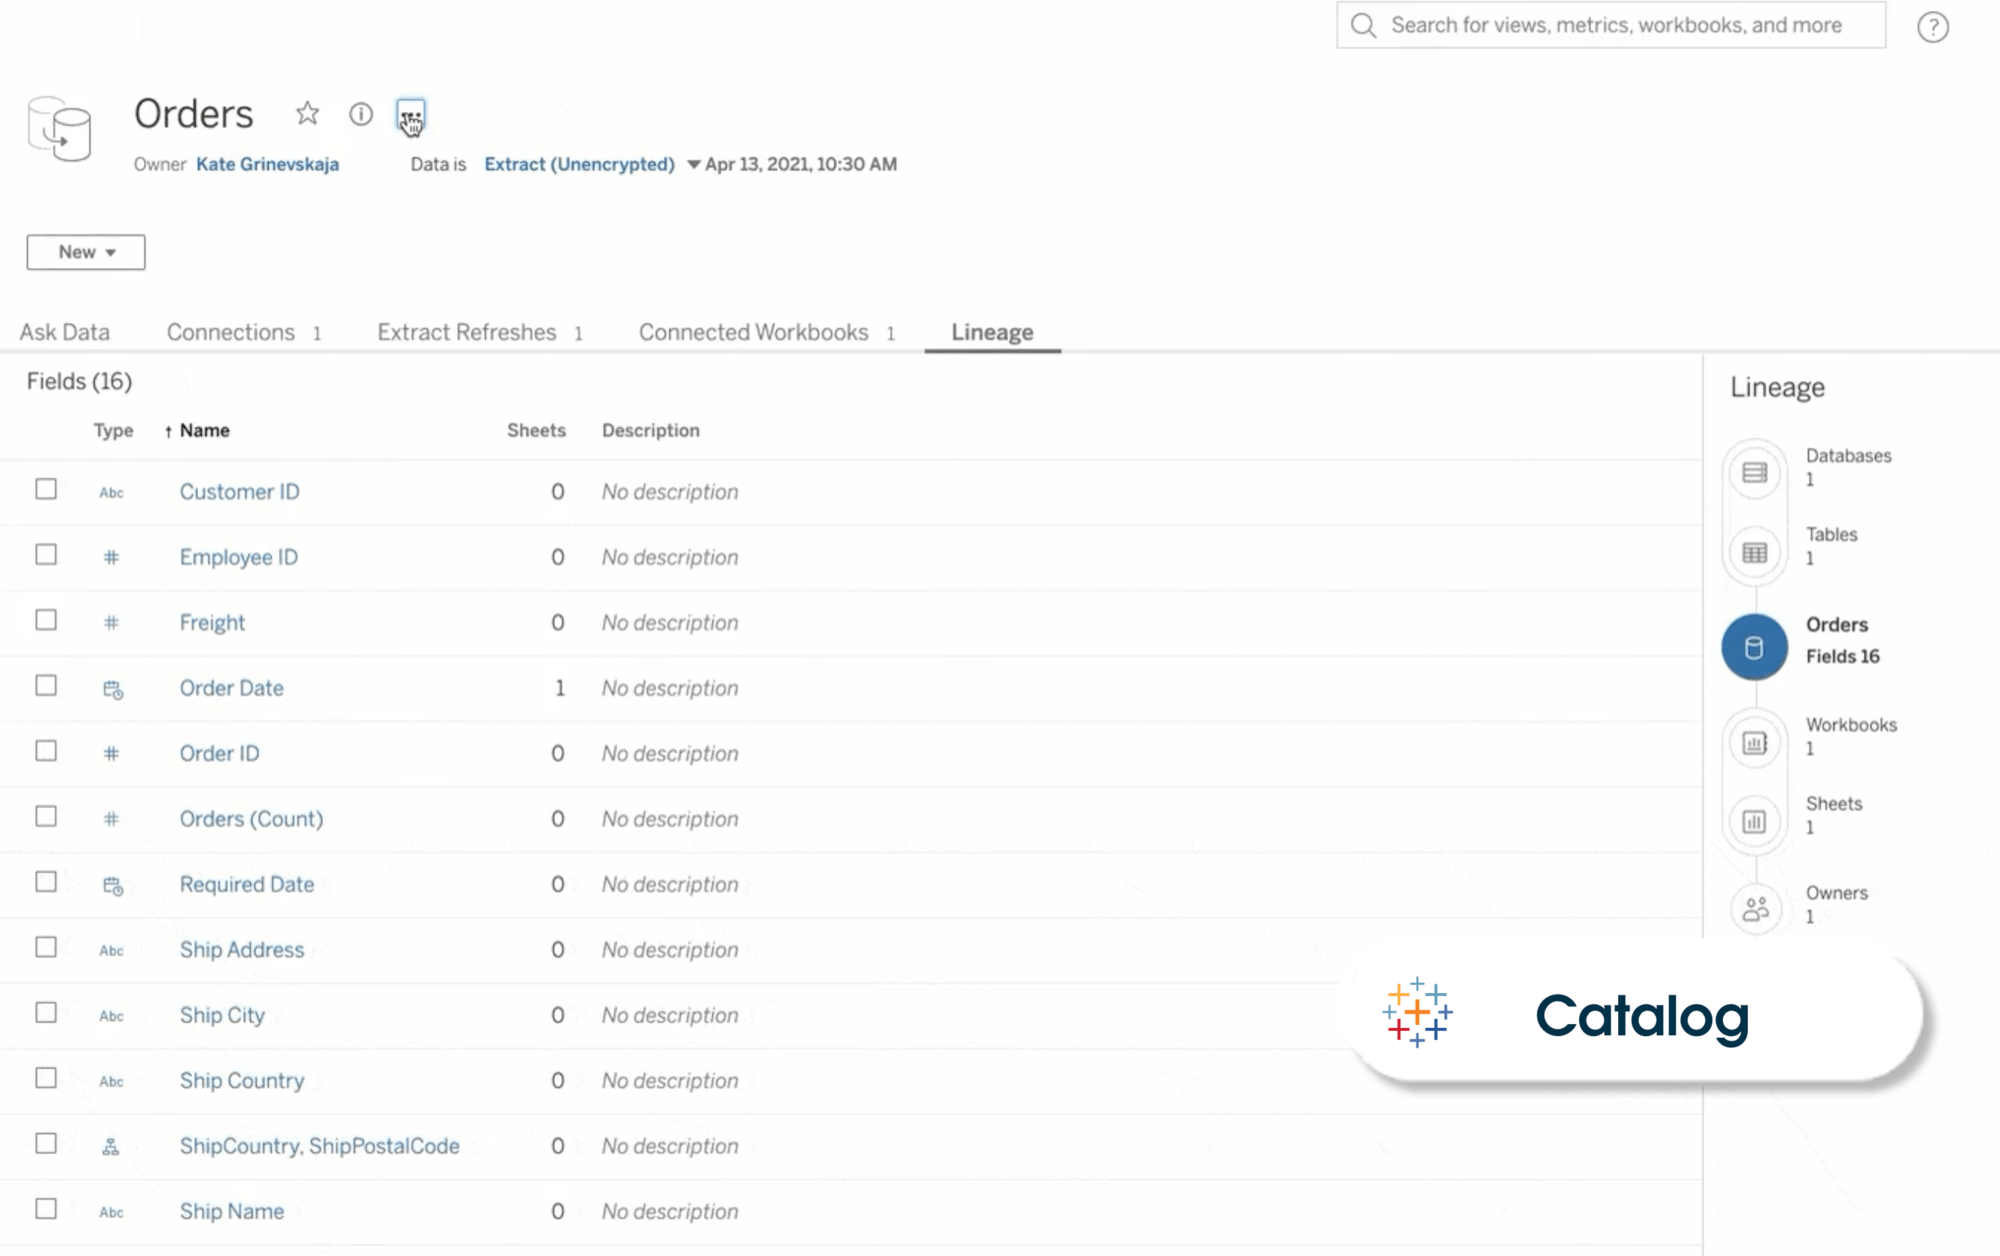
Catalog
Enhanced data trust, visibility, and discoverability
Tableau Catalog automatically catalogs all your data assets and sources into one central list and provides metadata in context for fast data discovery. It also helps you understand data lineage and integrates features like lineage, impact analysis, data dictionary, data quality warnings, and search into your Tableau applications, helping solve these problems differently from a stand-alone catalog.
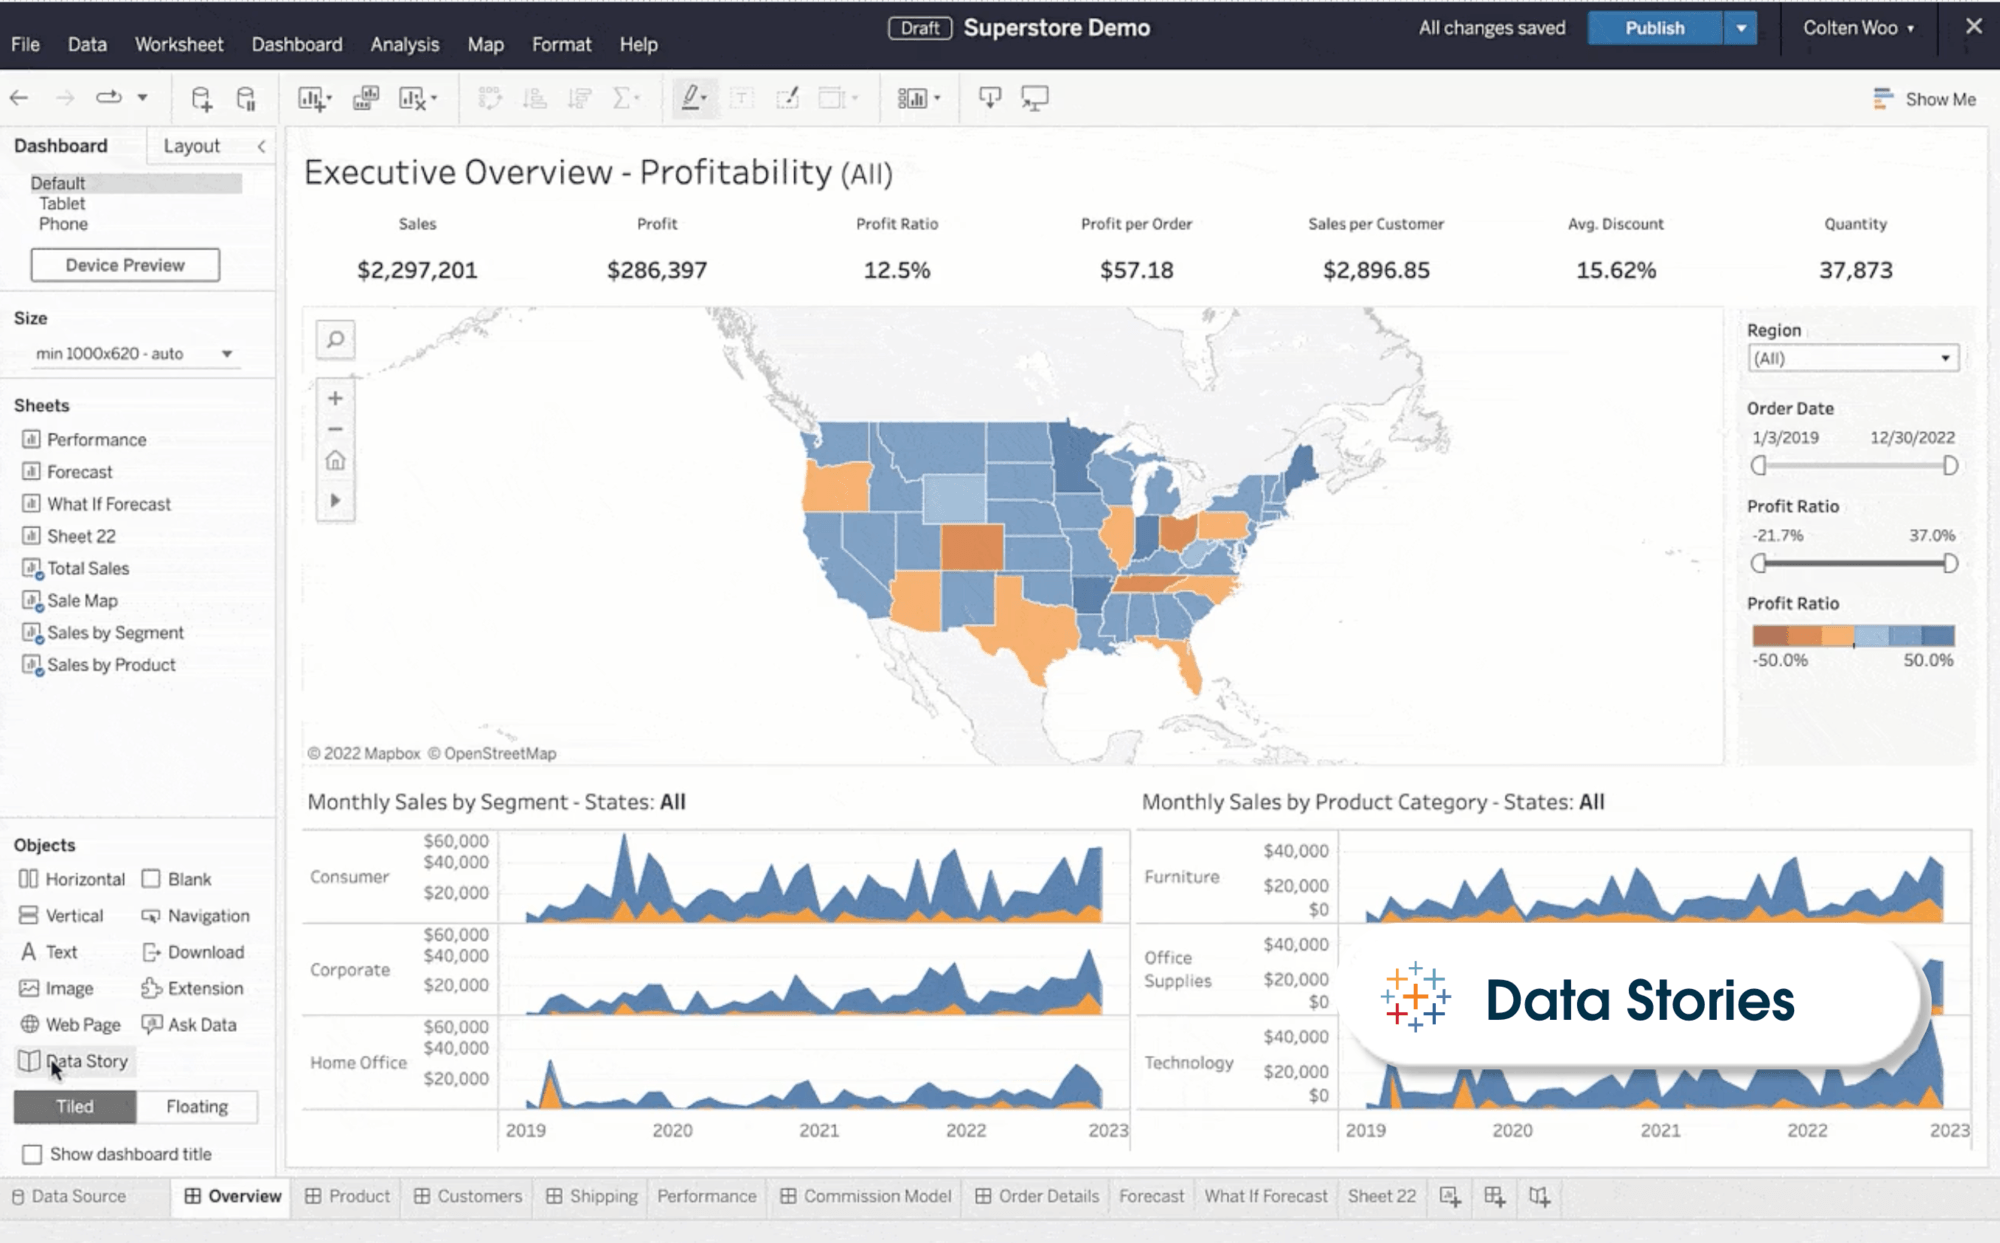
Data Stories
Natural language insights from your data
Data Stories is a really great tool that can help you save valuable time and resources by summarizing key insights in a clear and concise manner. With its advanced features, you can easily add automated plain-language explanations to your dashboards in just a few seconds. It was designed specifically for business users, so Data Stories provides an easy-to-understand experience that is tailored to your needs. It also proactively surfaces relevant insights that may have been overlooked, making sure that you always stay on top of your game. Whether you're an analyst or a business owner, Data Stories is the perfect solution for anyone looking to streamline their workflow and gain valuable insights into their data.
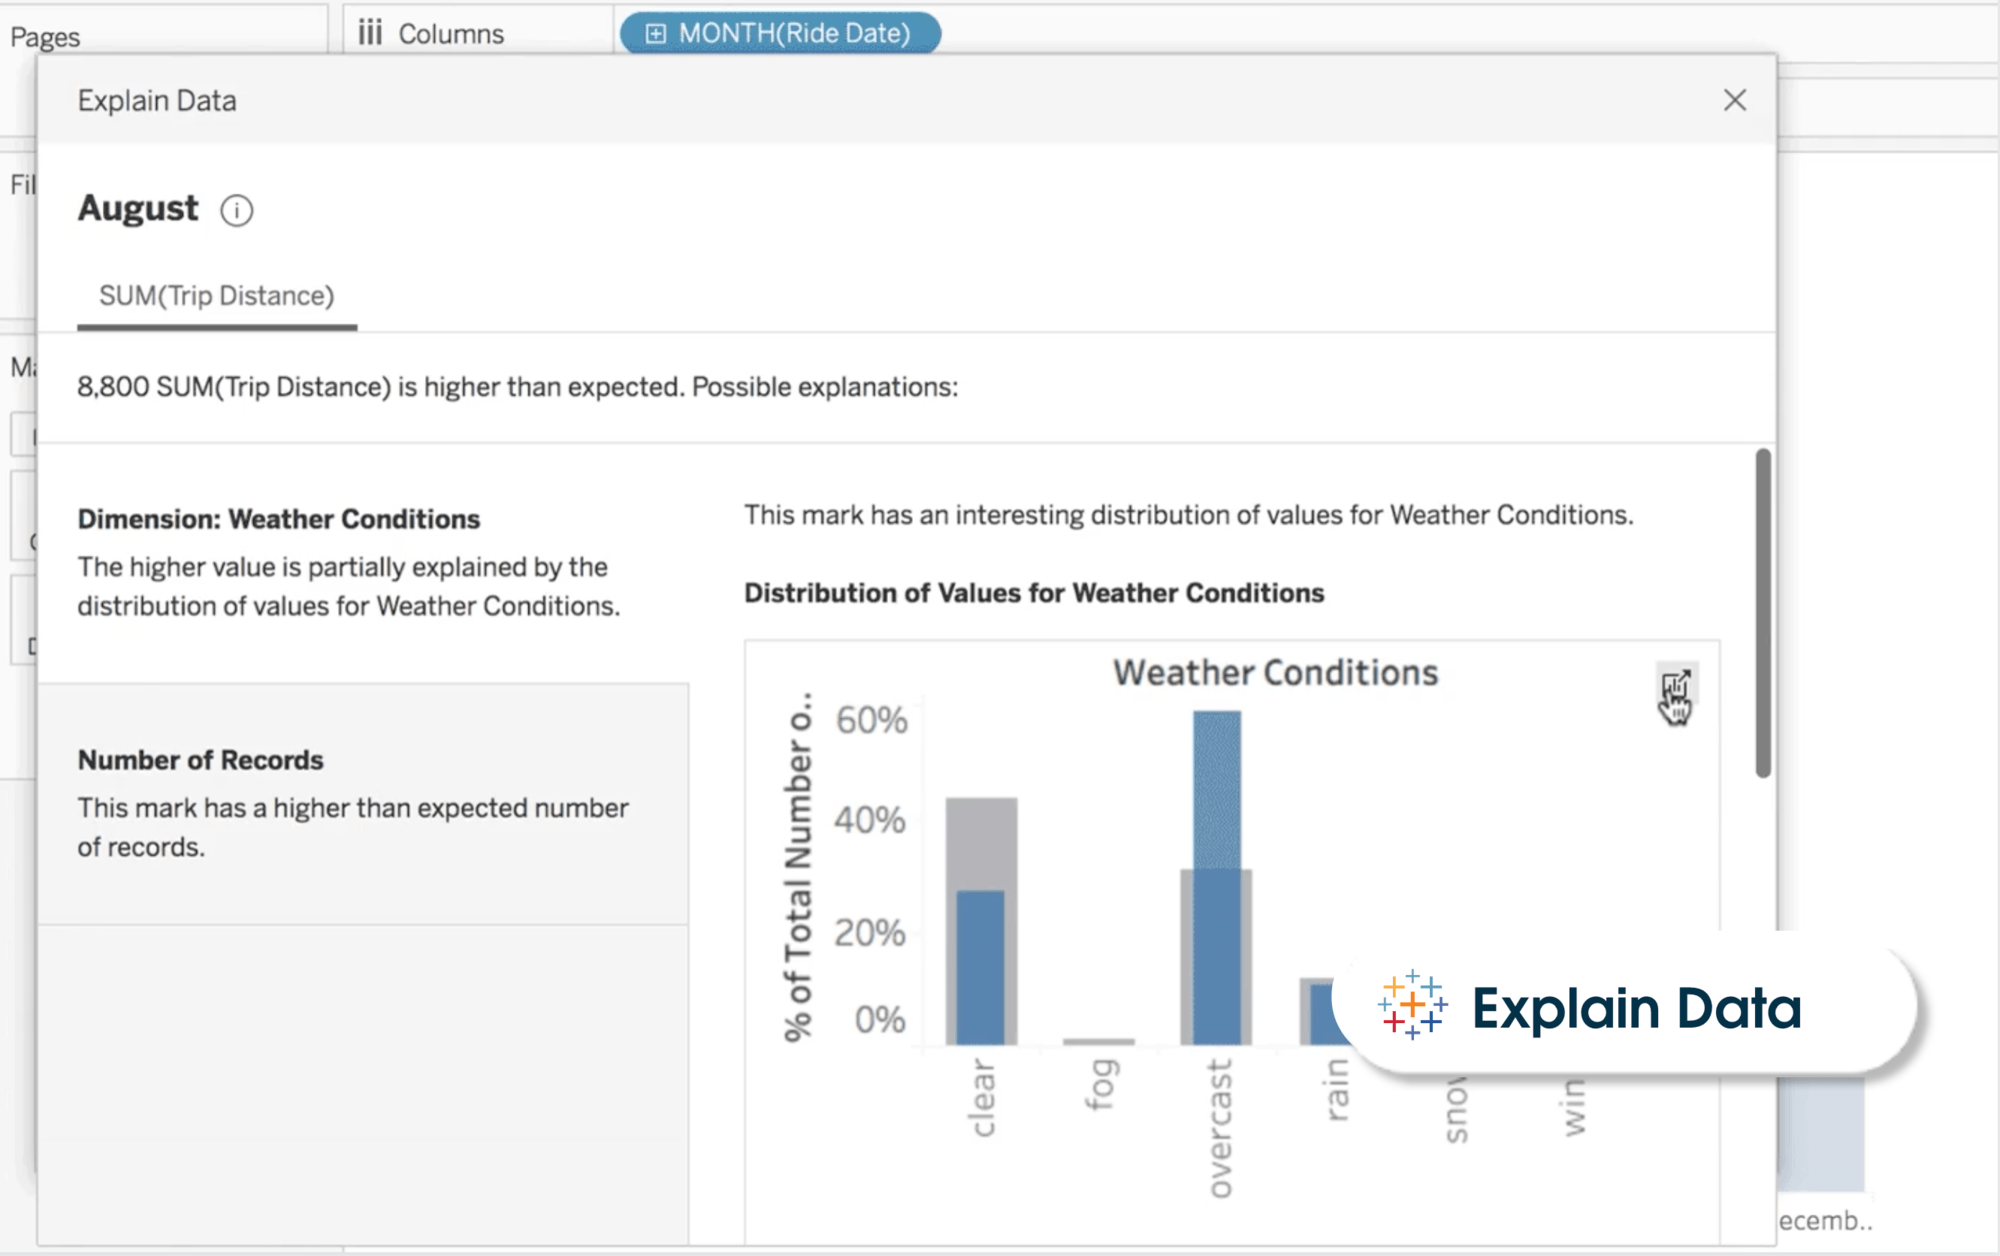
Explain Data
Discover the “why” in your data
Data exploration can be a complicated and time-consuming process, but Explain Data makes it easy to uncover and describe relationships in your data. By giving you the ability to inspect and locate key data points, you can quickly and seamlessly dive deeper into the marks in a visualization. With just a single click, Explain Data can provide AI-driven answers and easy-to-understand explanations for the value of any data point. Also, this tool offers interactive visualizations, which means you can explore your data in a more intuitive and engaging way.
Forecasting & Predictive Modeling
Improve decisions with predicted future trends
Tableau allows analysts to create predictive models native to the platform. With native predictive modeling, you can create a model that understands how your data is distributed around a trend line in your viz. In addition, analysts can leverage these functions within table calculations to gain deeper insights into their data. Using exponential smoothing, you can generate forecasts for any data set with date dimensions. You can also use our automatic model, specify an additive or multiplicative model, and use predictive modeling in table calculations.

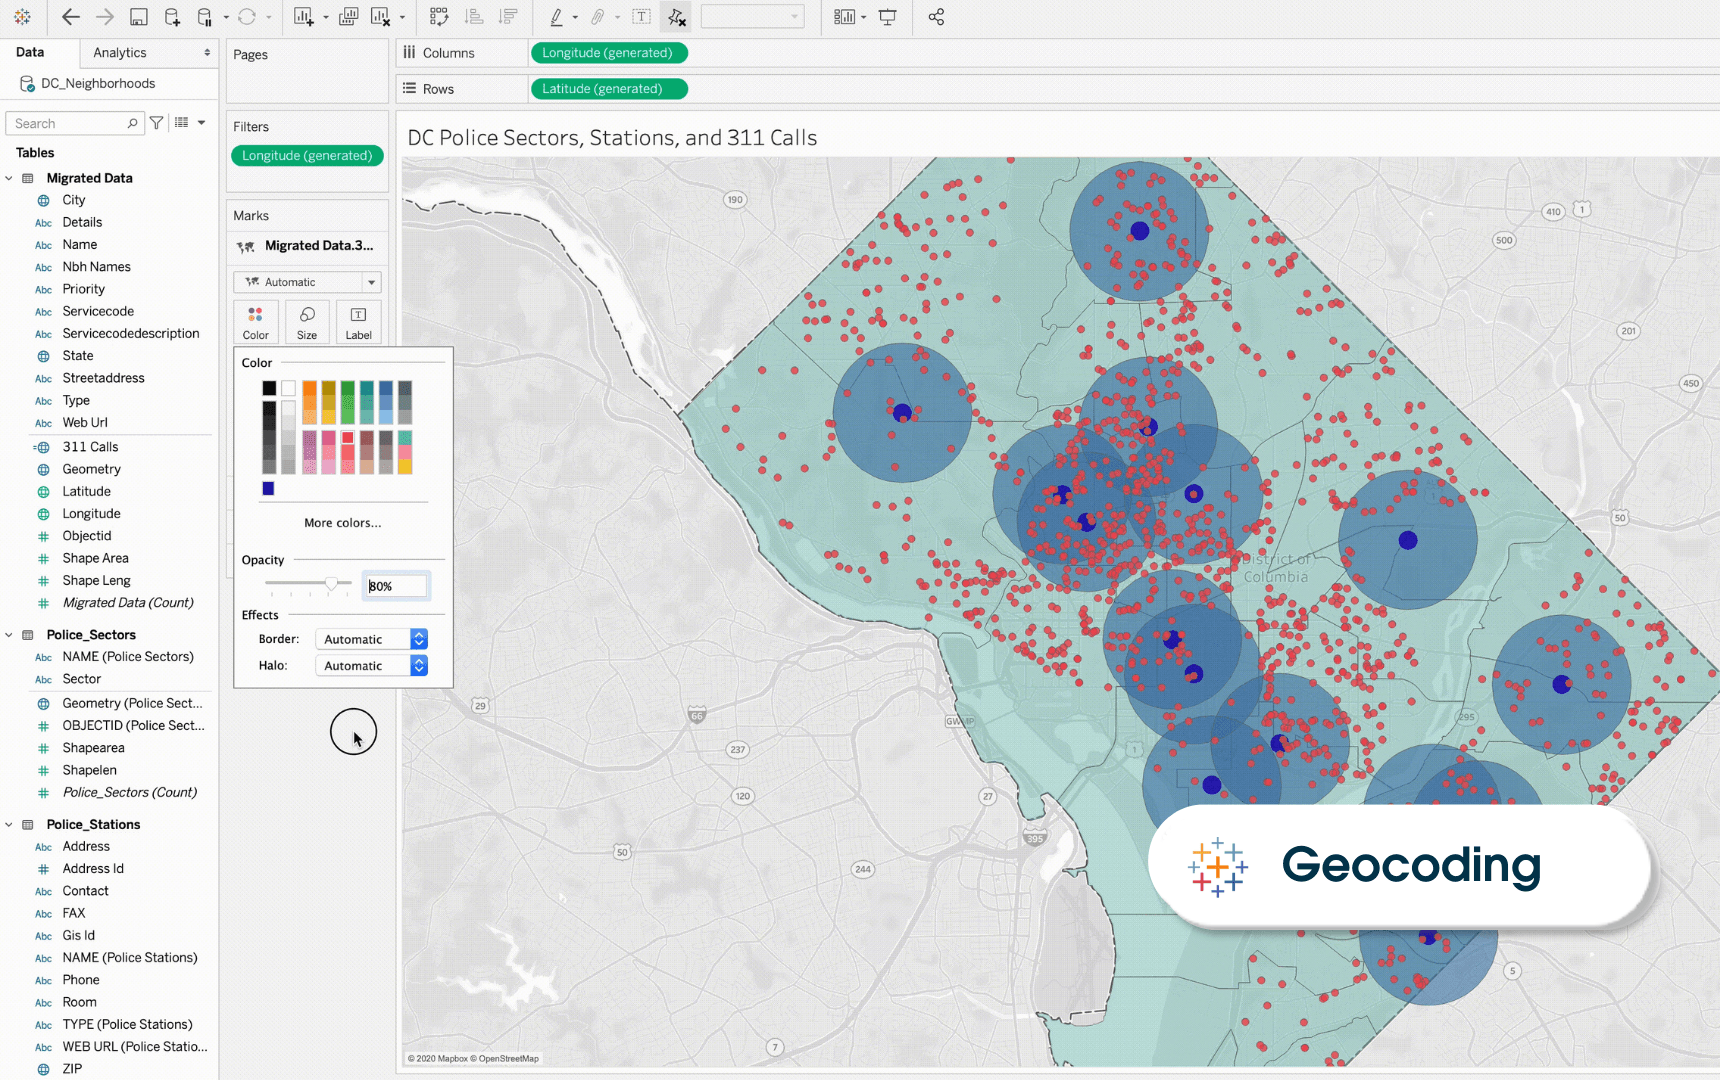
Geospatial Analytics
Out-of-box custom geocoding & location insights
Geospatial visualization showcases data in relation to its physical location. If you want to look at your data geographically, you can plot it on a map in Tableau. You can easily get granular geospatial insights from all your enterprise data. Using geo hierarchies, you can go deeper into your data and find new insights. Additionally, using spatial joins lets you show the relationships between data with varying spatial definitions. Finally, Tableau allows you to create custom territories using Tableau groups and overlay data with demographic information, giving you a comprehensive view of your data.
Hyper
Supercharge your analytics with in-memory data engine
Hyper is Tableau's blazingly fast SQL engine that lets you do fast real-time analytics, interactive exploration, and ETL transformations through Tableau Prep. This amazing in-memory data engine solution lets users analyze large or complex data sets faster by efficiently assessing analytical queries directly in the transactional database. Hyper really speeds up data processing, reduces load times, and improves dashboard performance for all users. Also, this technology provides faster data refreshes and extracts, delivering near-real-time insights while minimizing the data's memory footprint and storage requirements.
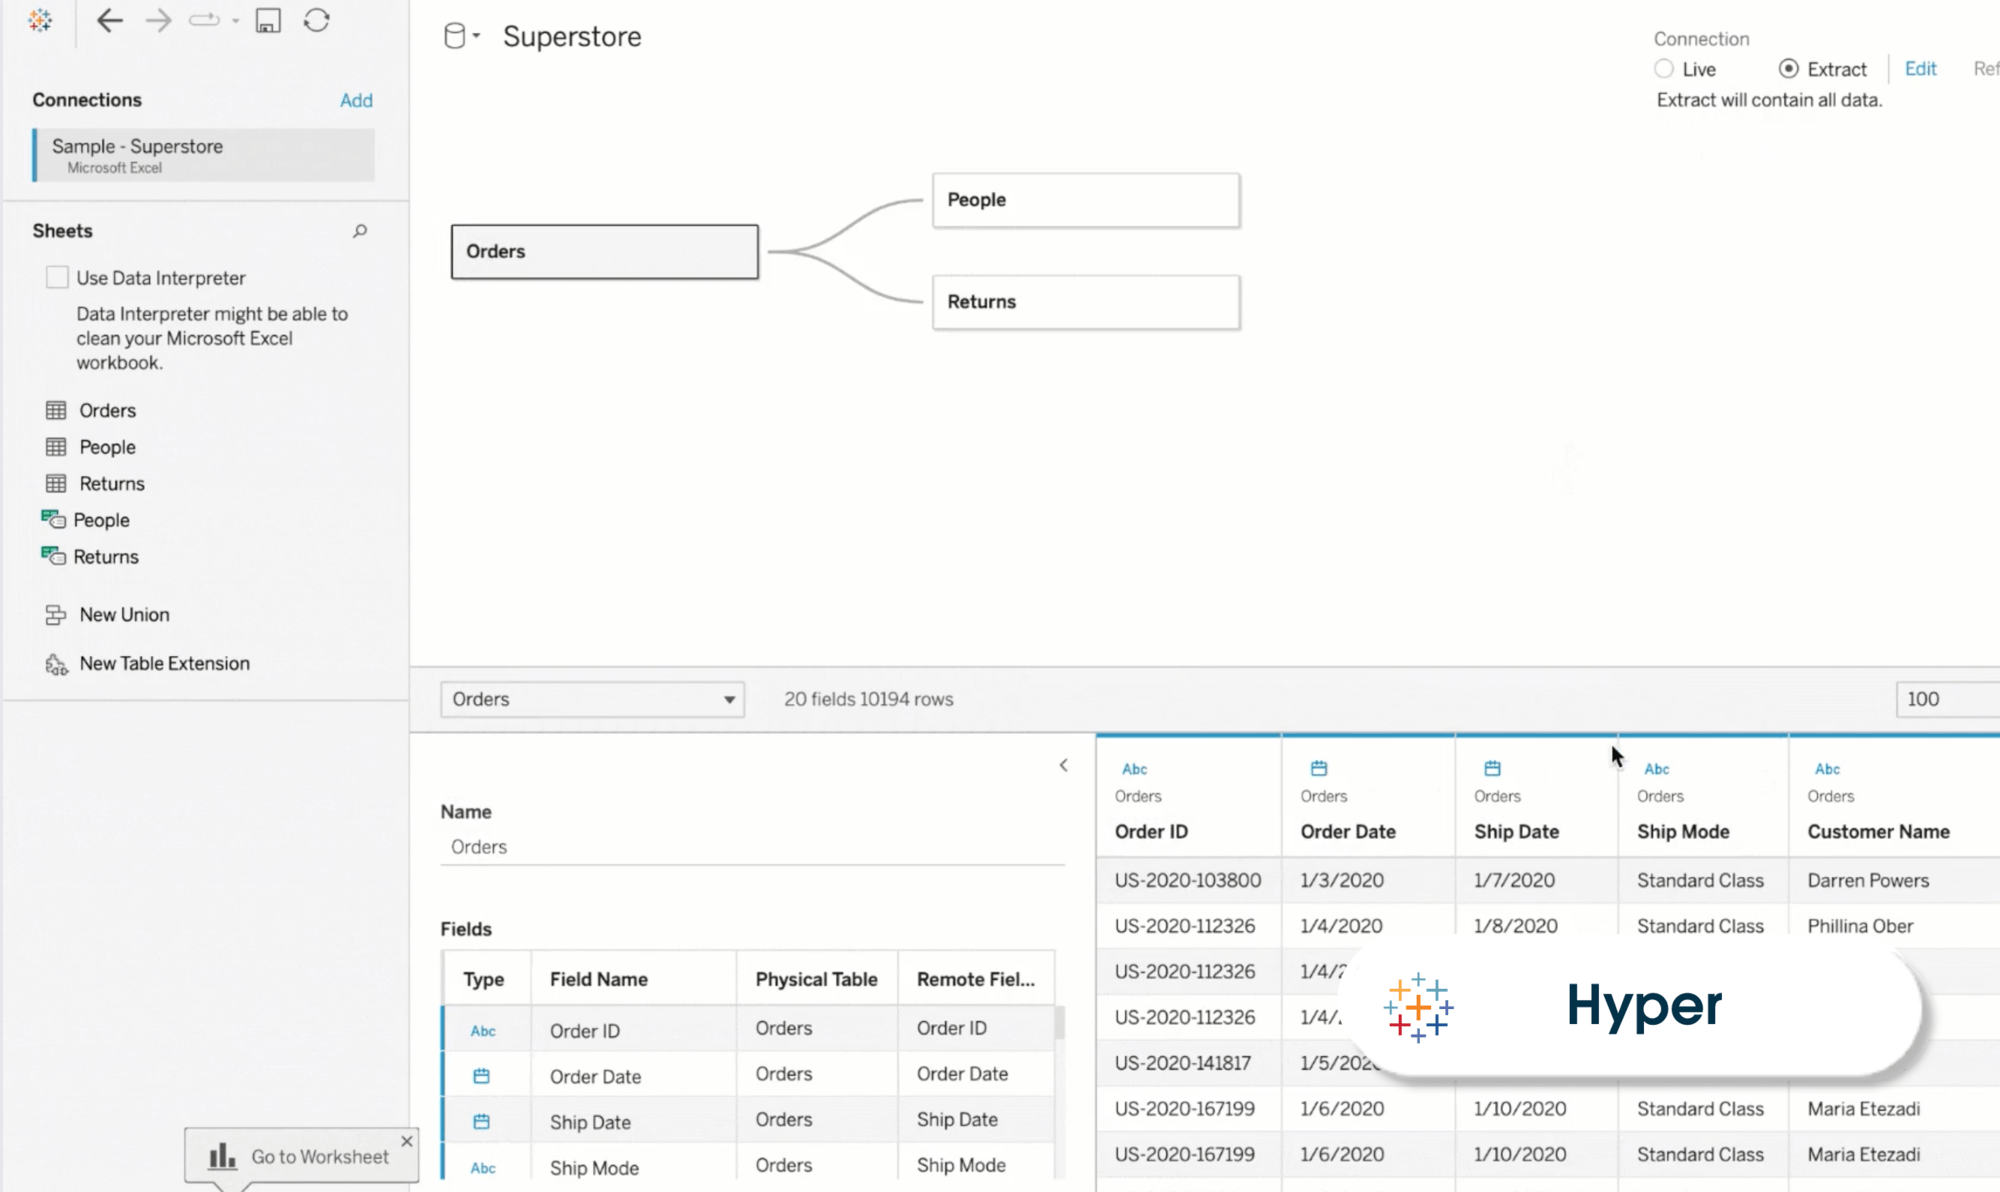
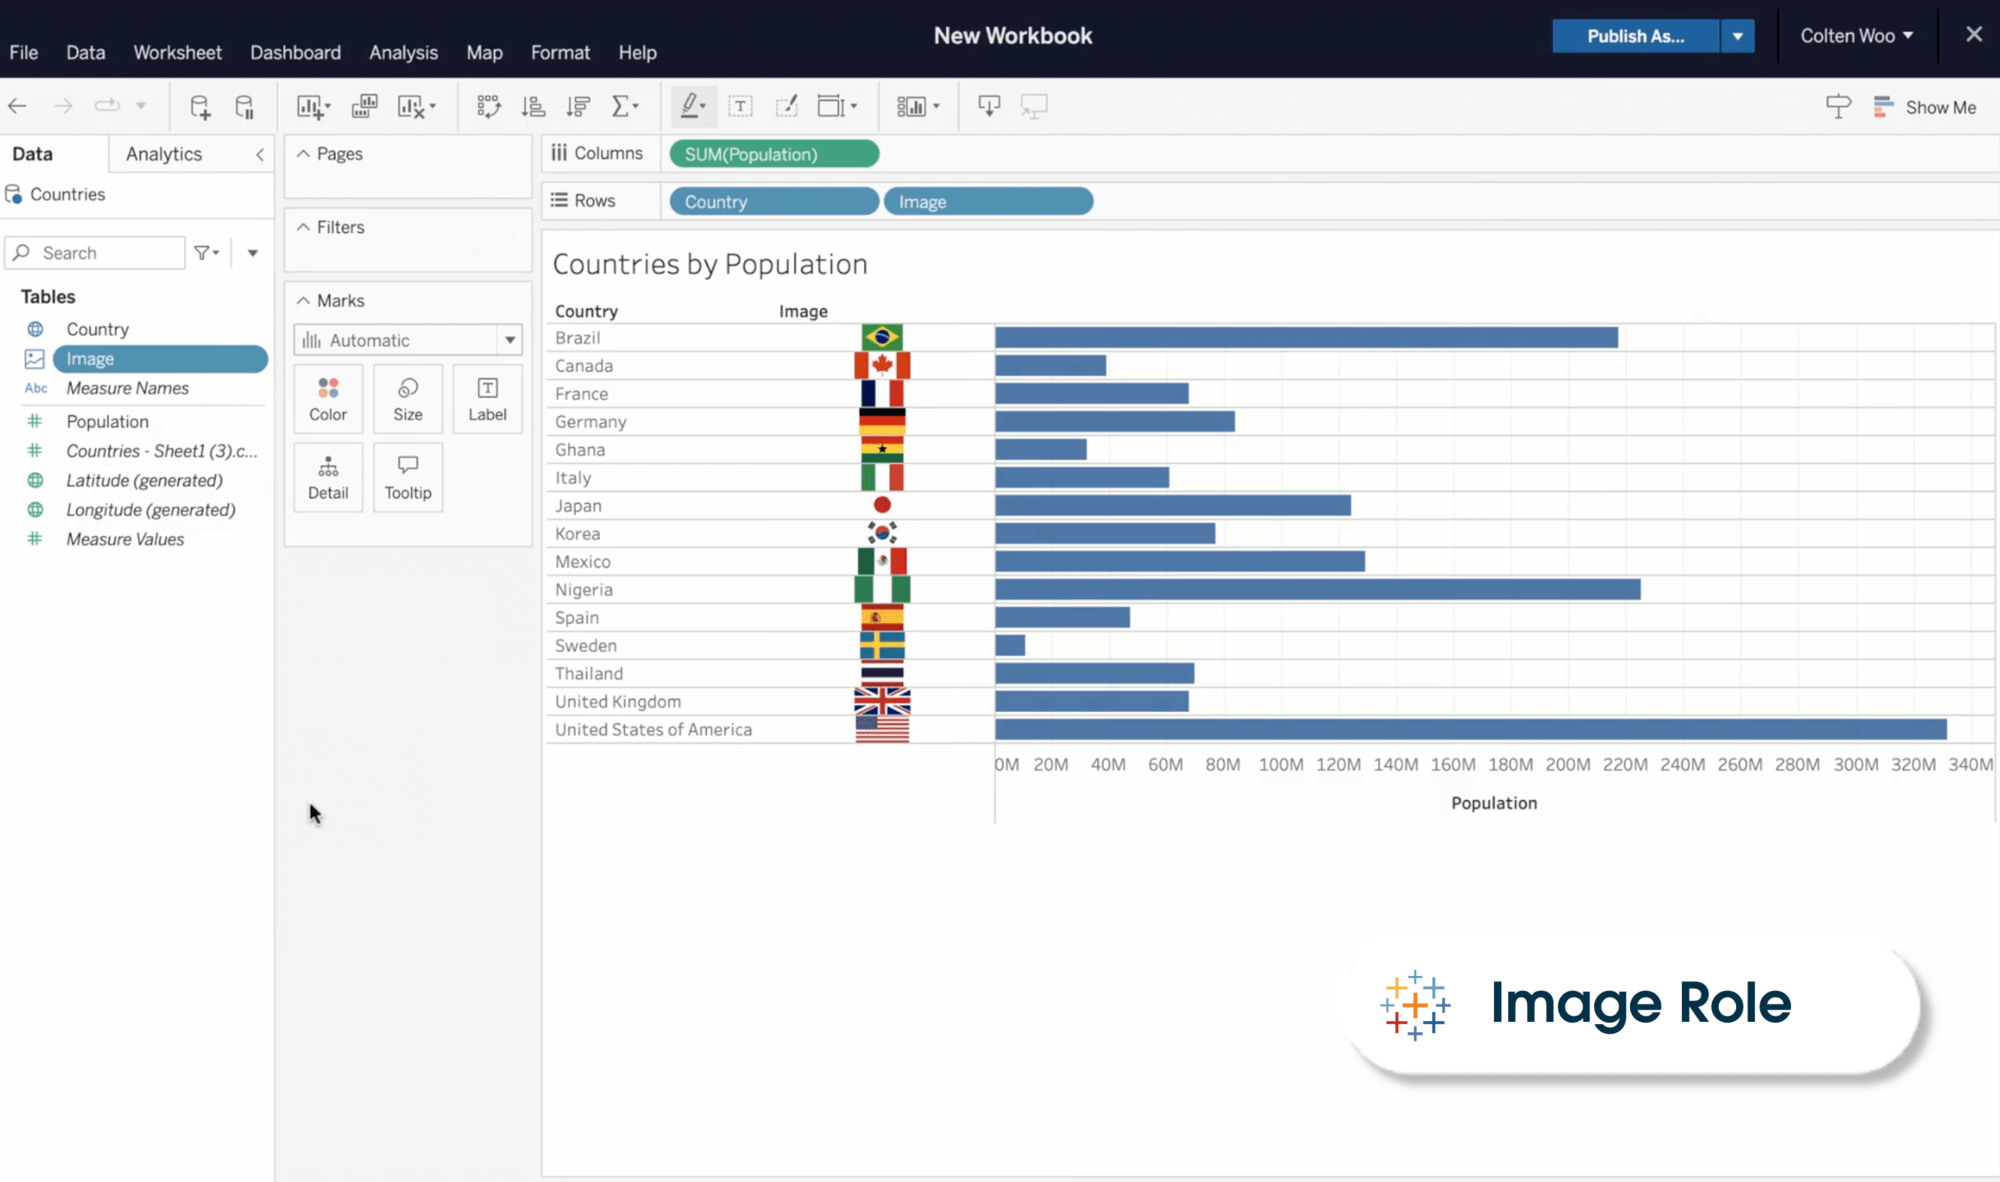
Image Role
Empower your analytics with embedded images
Incorporating image assets into Tableau is a whole lot easier with the help of Image Role. This powerful semantic field provides a highly scalable and automated solution for importing, aligning, reusing, and updating graphics. With Image Role, you can effortlessly map images to links in your data and encode them into exportable rows and columns. By using images instead of obscure product names or item codes, you can vastly improve the user experience. Plus, these images are externally managed, so storage costs are minimum, and the workbook size stays manageable. With Image Role, you'll be able to streamline your image asset management processes like never before.
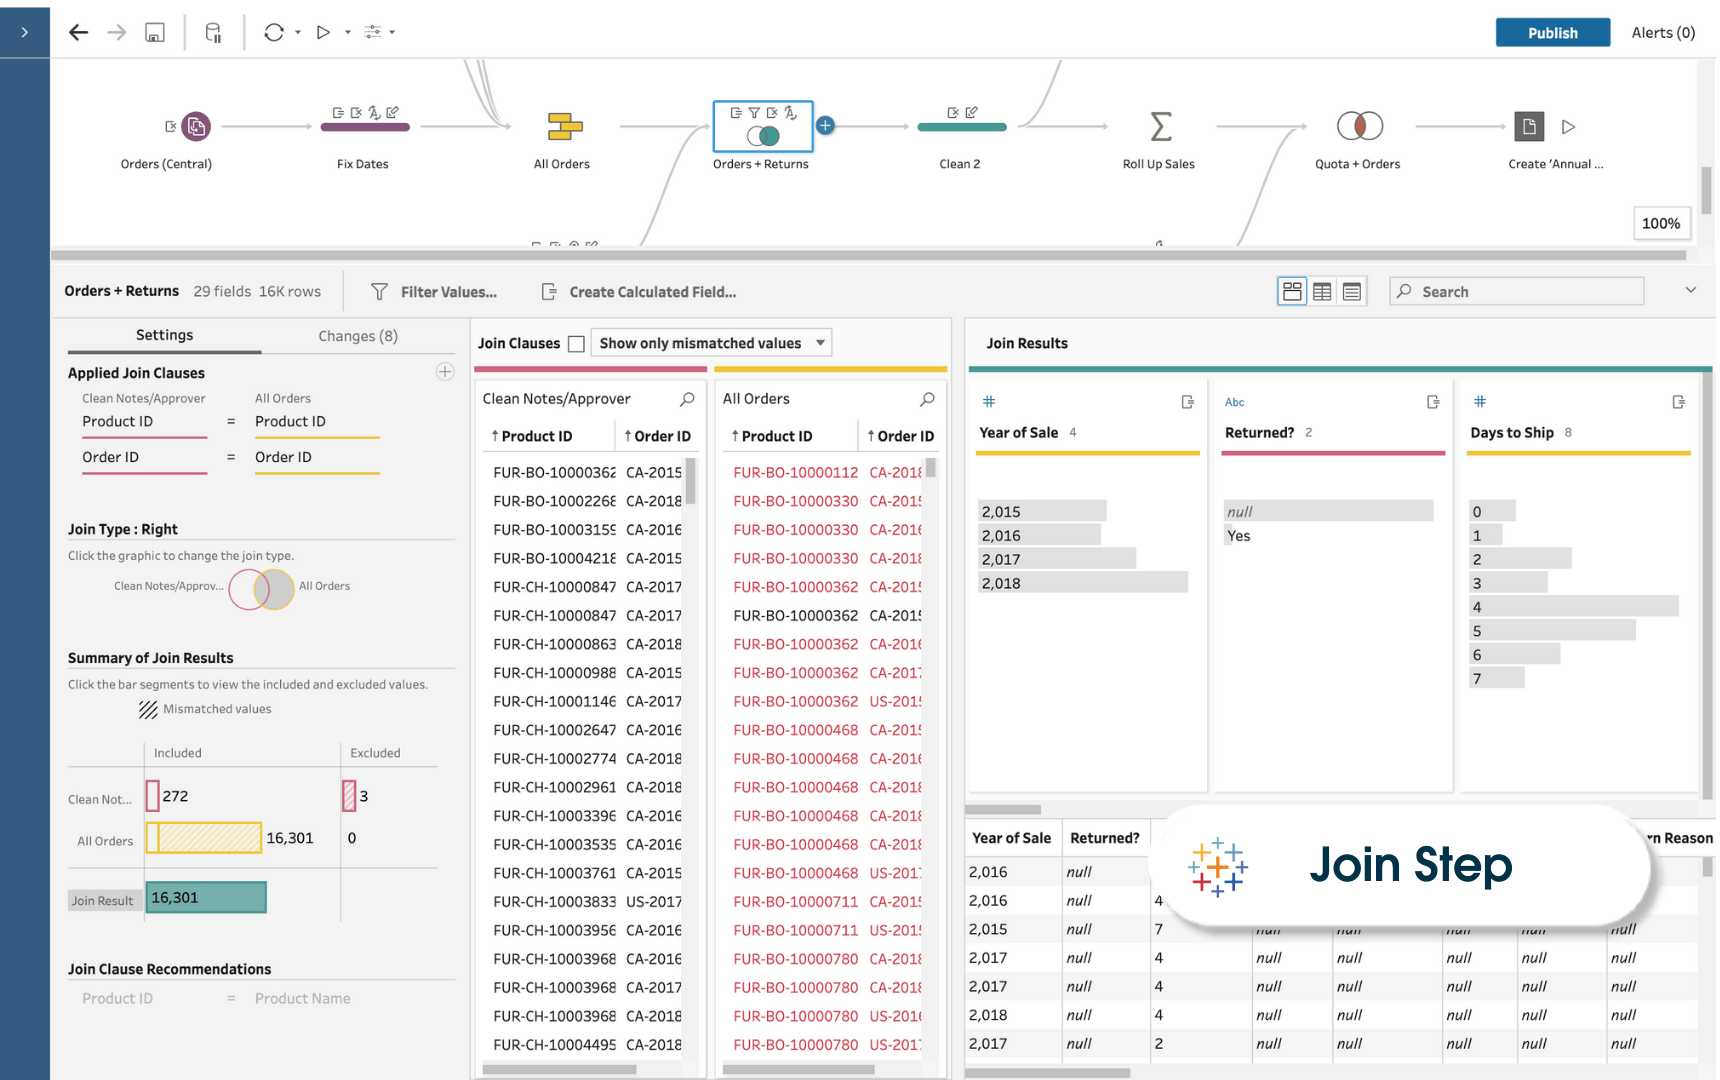
Join Step
Join data with ease
A Join Step in Tableau involves combining data from two or more tables based on a common field, creating a single unified dataset for analysis and visualization. This process allows you to merge related information from different sources, facilitating comprehensive insights and reporting. You can see the impacts of joins as you create data sources or write back to your database. You can also define how tables are related so that end users can start using the system without having to understand the details of data granularity.
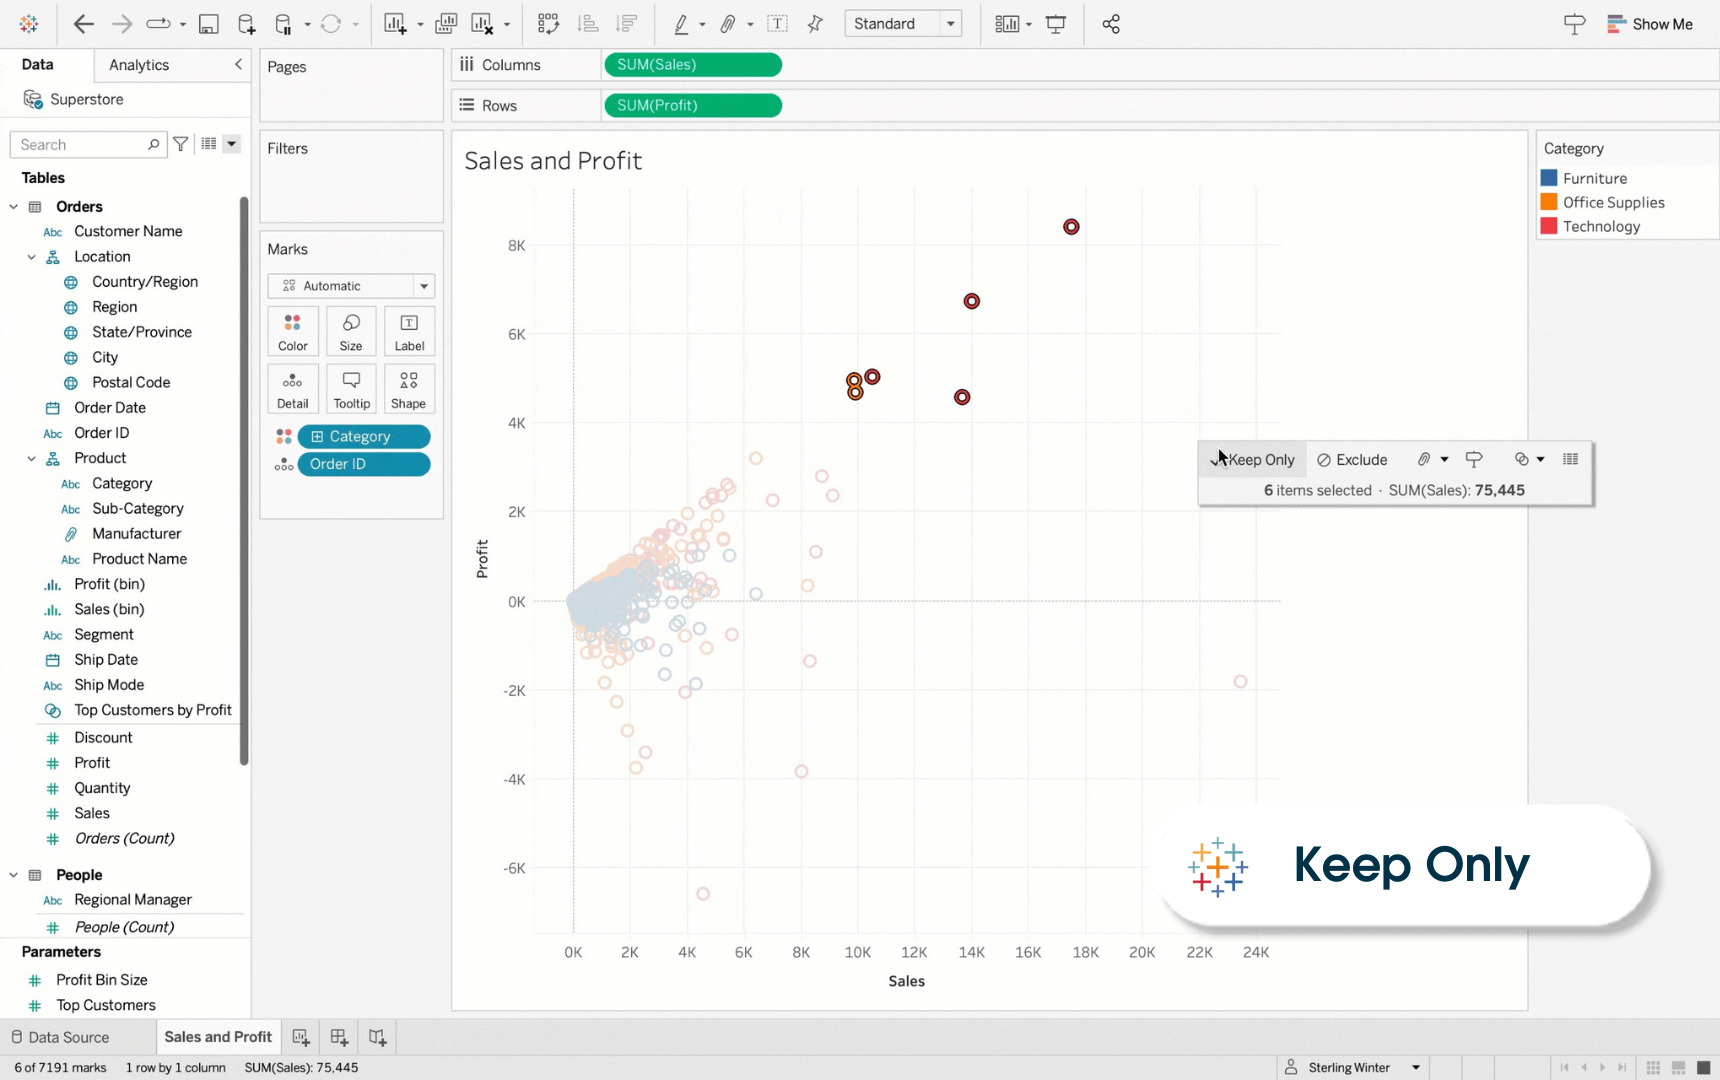
Keep Only
Quickly filter visualizations with the click of a button
Keep Only is a filtering action that retains data rows matching the selected values while excluding all other data rows from the view. This helps focus the analysis on specific subsets of data, revealing insights and patterns relevant to the chosen criteria. You can drill down into specific areas of visualizations without navigating long or complex filter lists. It allows you to select relevant points and share customized insights with stakeholders intuitively.
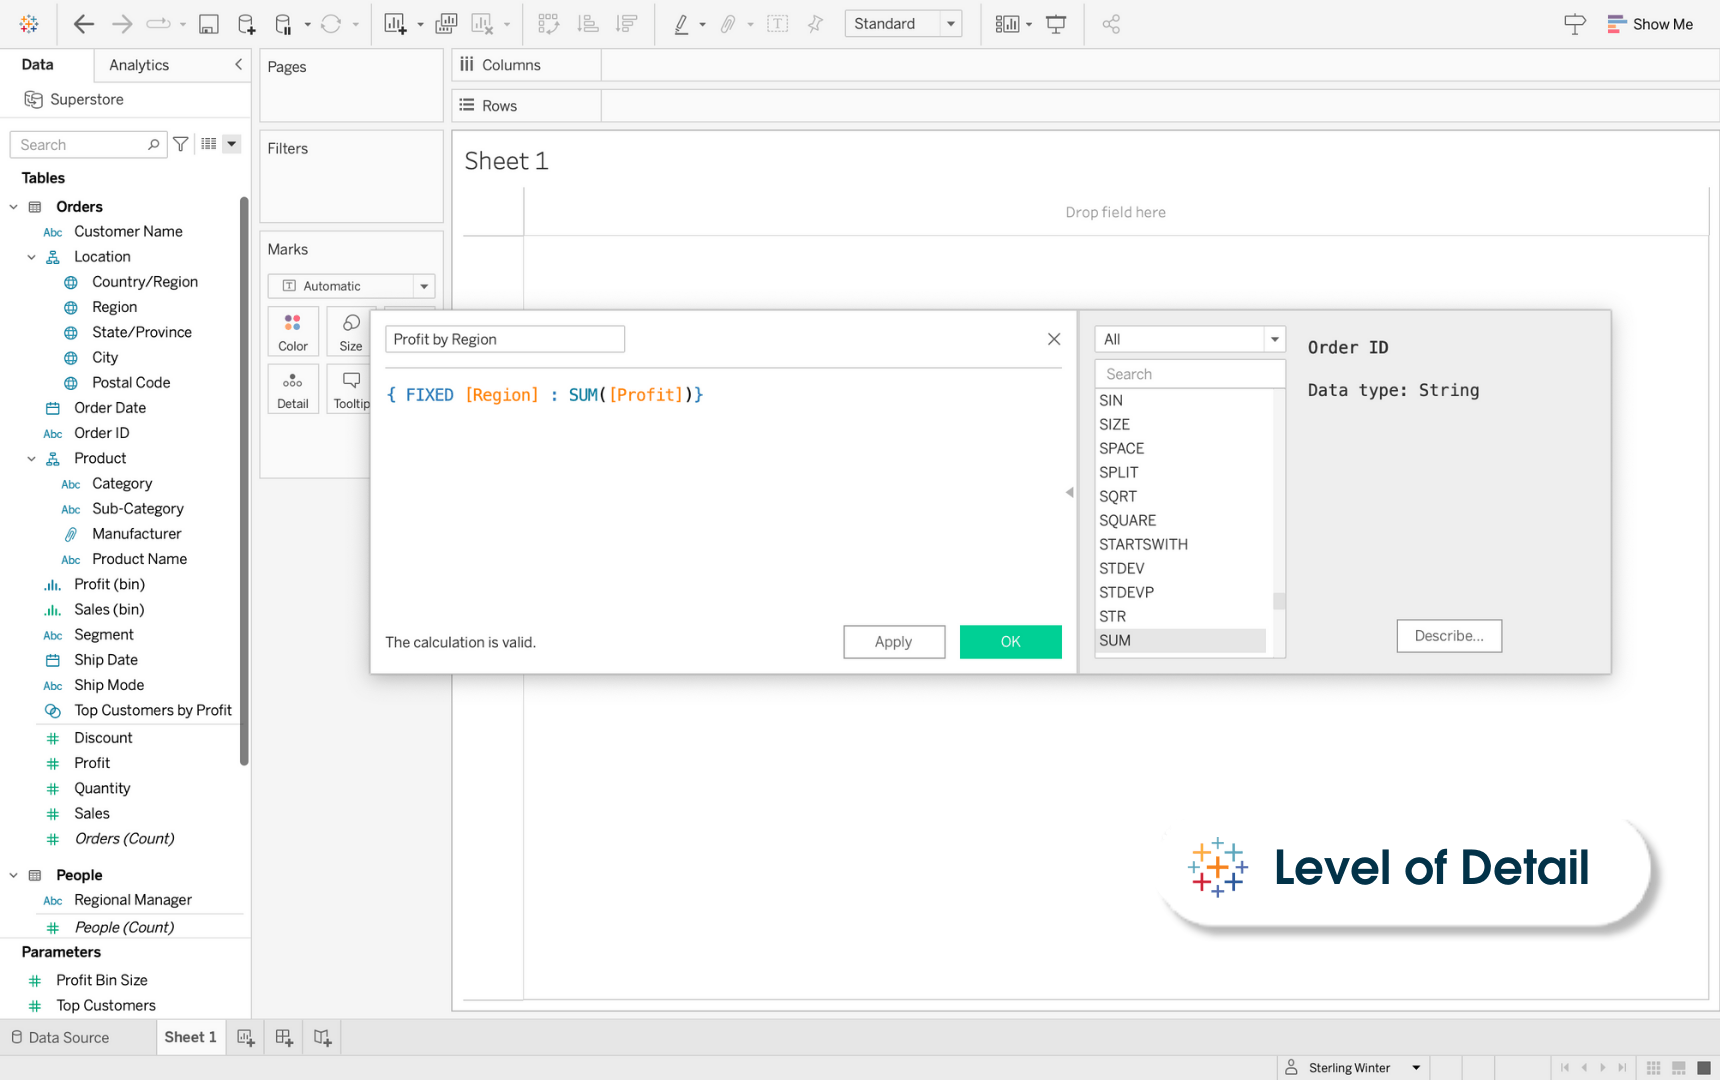
LOD Expressions
Create flexible, granular calculations with ease
Level of Detail (LOD) expressions run complex queries involving many dimensions at the data source level instead of bringing all the data to the Tableau interface. LOD expressions are a way to efficiently compute aggregations that are not at the level of detail of the visualization. A simple example is adding a dimension to an already calculated aggregate value. They help you quickly get answers involving multiple levels of granularity in a single visualization. You can actually define the level of detail at which a calculation should be performed independently of the Viz. You can also create more sophisticated dashboards that show different detail levels for other visualization parts, if you'd like.
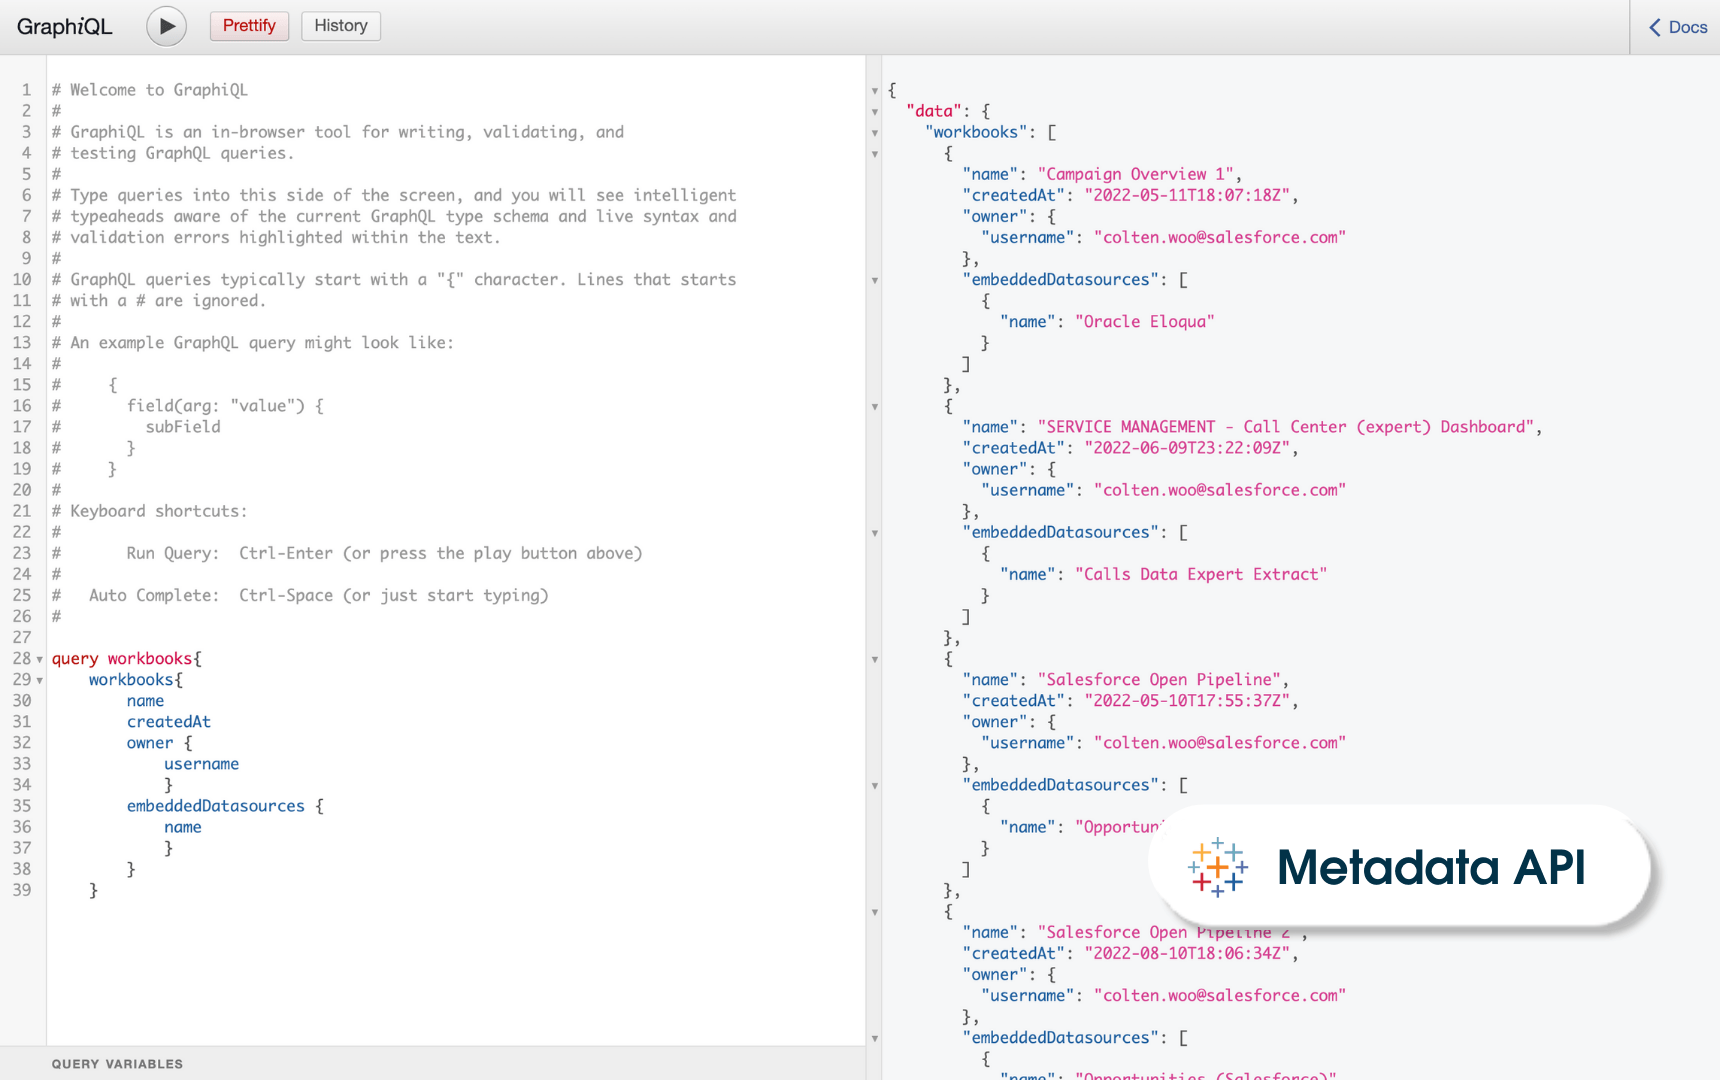
Metadata API
Query and discover metadata about Tableau content and external assets
Metadata API finds, tracks, stores, and then shows information about Tableau content. The content can be categorized by type (e.g., table or workbook). The content can be unique to Tableau (e.g., embedded data sources and calculated fields), and its external assets are not unique to Tableau (e.g., database tables and columns). You can discover data and metadata used across your organization and perform impact analysis to determine how downstream and upstream changes affect workflows. The Metadata API also allows you to use our strategic partners, such as Alation and Collibra, to integrate deeply with their purpose-built data catalog offerings.
Nested Projects
Segment content and users to meet your access requirements
Nested Projects lets analytics professionals fully control how content is organized within their area. They can create child projects, assign ownership to the appropriate individuals, and then manage their projects and everything under them. You can grant granular access to content across departments, teams, or people and streamline governance by enabling project leaders to oversee relevant permissions and content. Nested projects also let you set permissions at the top project level and cascade them down into all subprojects. 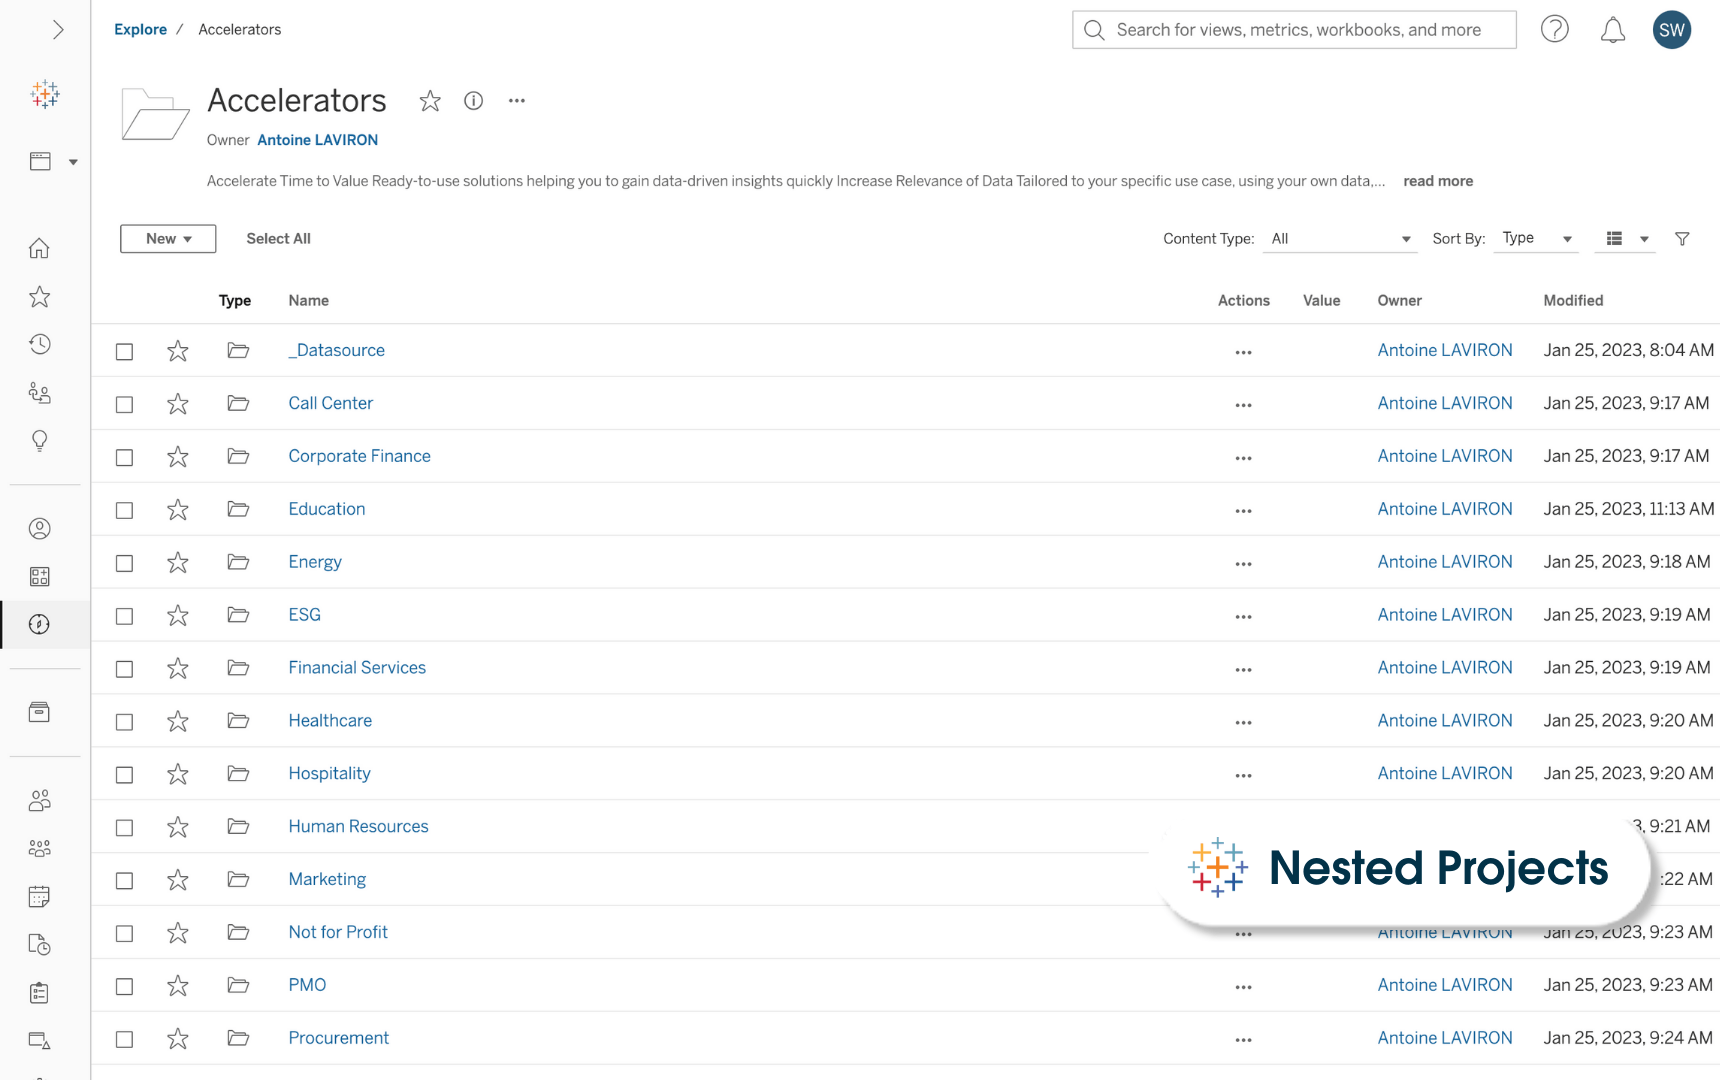
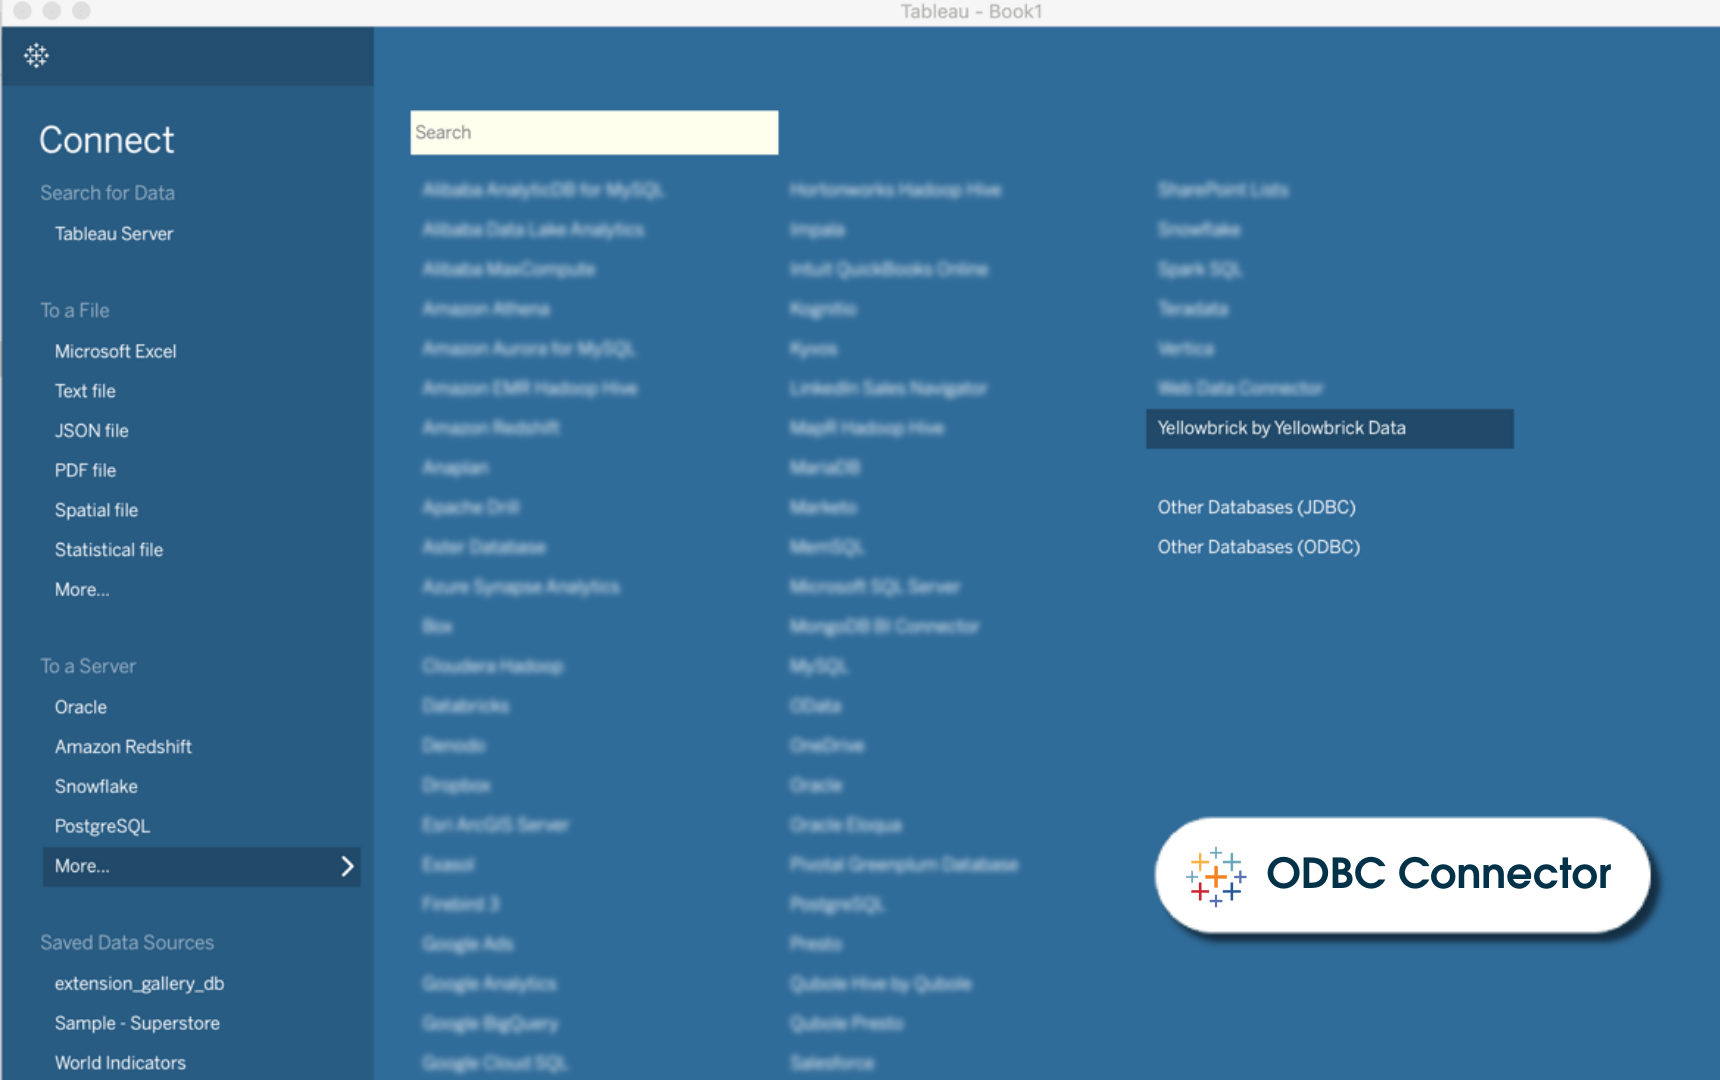
ODBC Connector
Bring all your data to Tableau with ease
An ODBC (Open Database Connectivity) connector for Tableau is like a bridge between Tableau and different databases, enabling connectivity and interaction through a standarzised protocol. ODBC is an industry standard that allows various software to access data. An ODBC connector lets you access any data source that supports the SQL standard and implements the ODBC API. By installing the right ODBC driver for the specific database, users can create data source connections within Tableau, making it easier to retrieve, query, and visualize data. This allows you to retrieve data into a Tableau extract and use the full Tableau capabilities to work with the data.
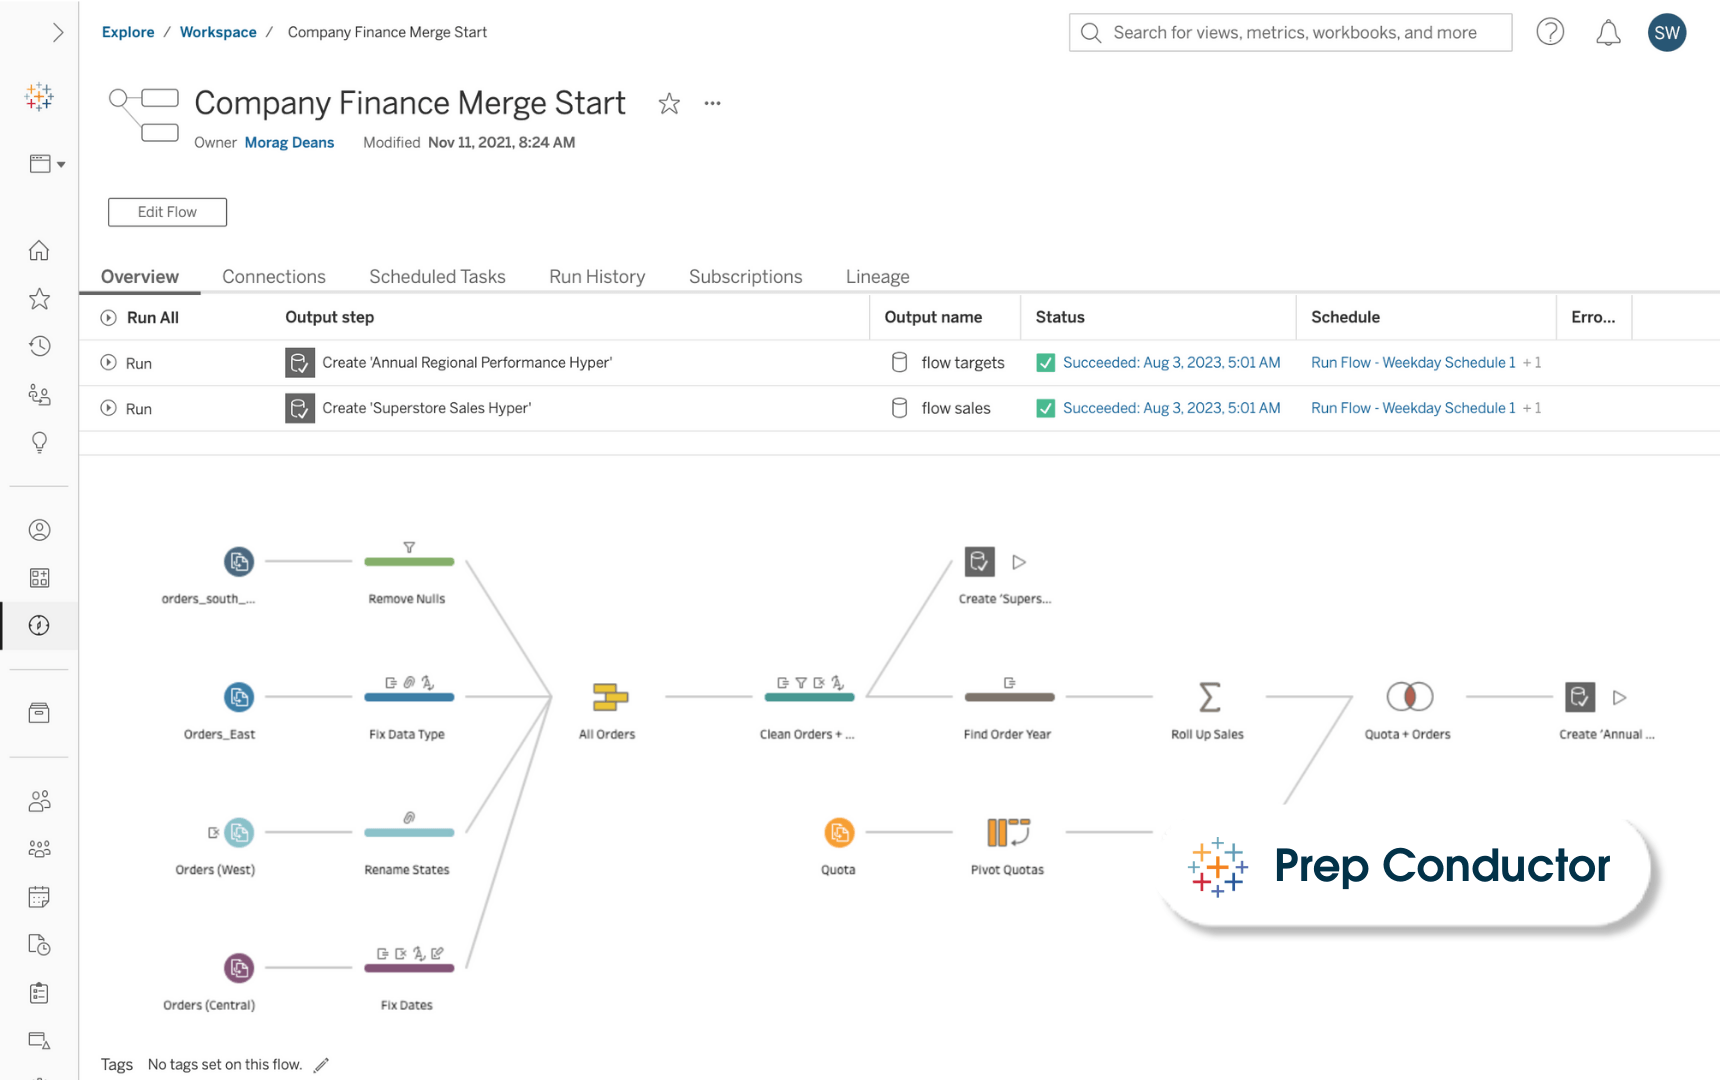
Prep Conductor
Automate your data workflows effortlessly
Tableau Prep Conductor lets you use Tableau's scheduling and tracking functionality to run your flows automatically and update the flow output. It also lets users view and monitor the details of their flows. In case of failed flows, it generates alerts. Tableau Prep Conductor can also help users view the data flow results and edit existing flows. Prep Conductor is fully integrated with the Tableau platform, so analysts and data stewards can use a server environment's horsepower, permissions, and security.
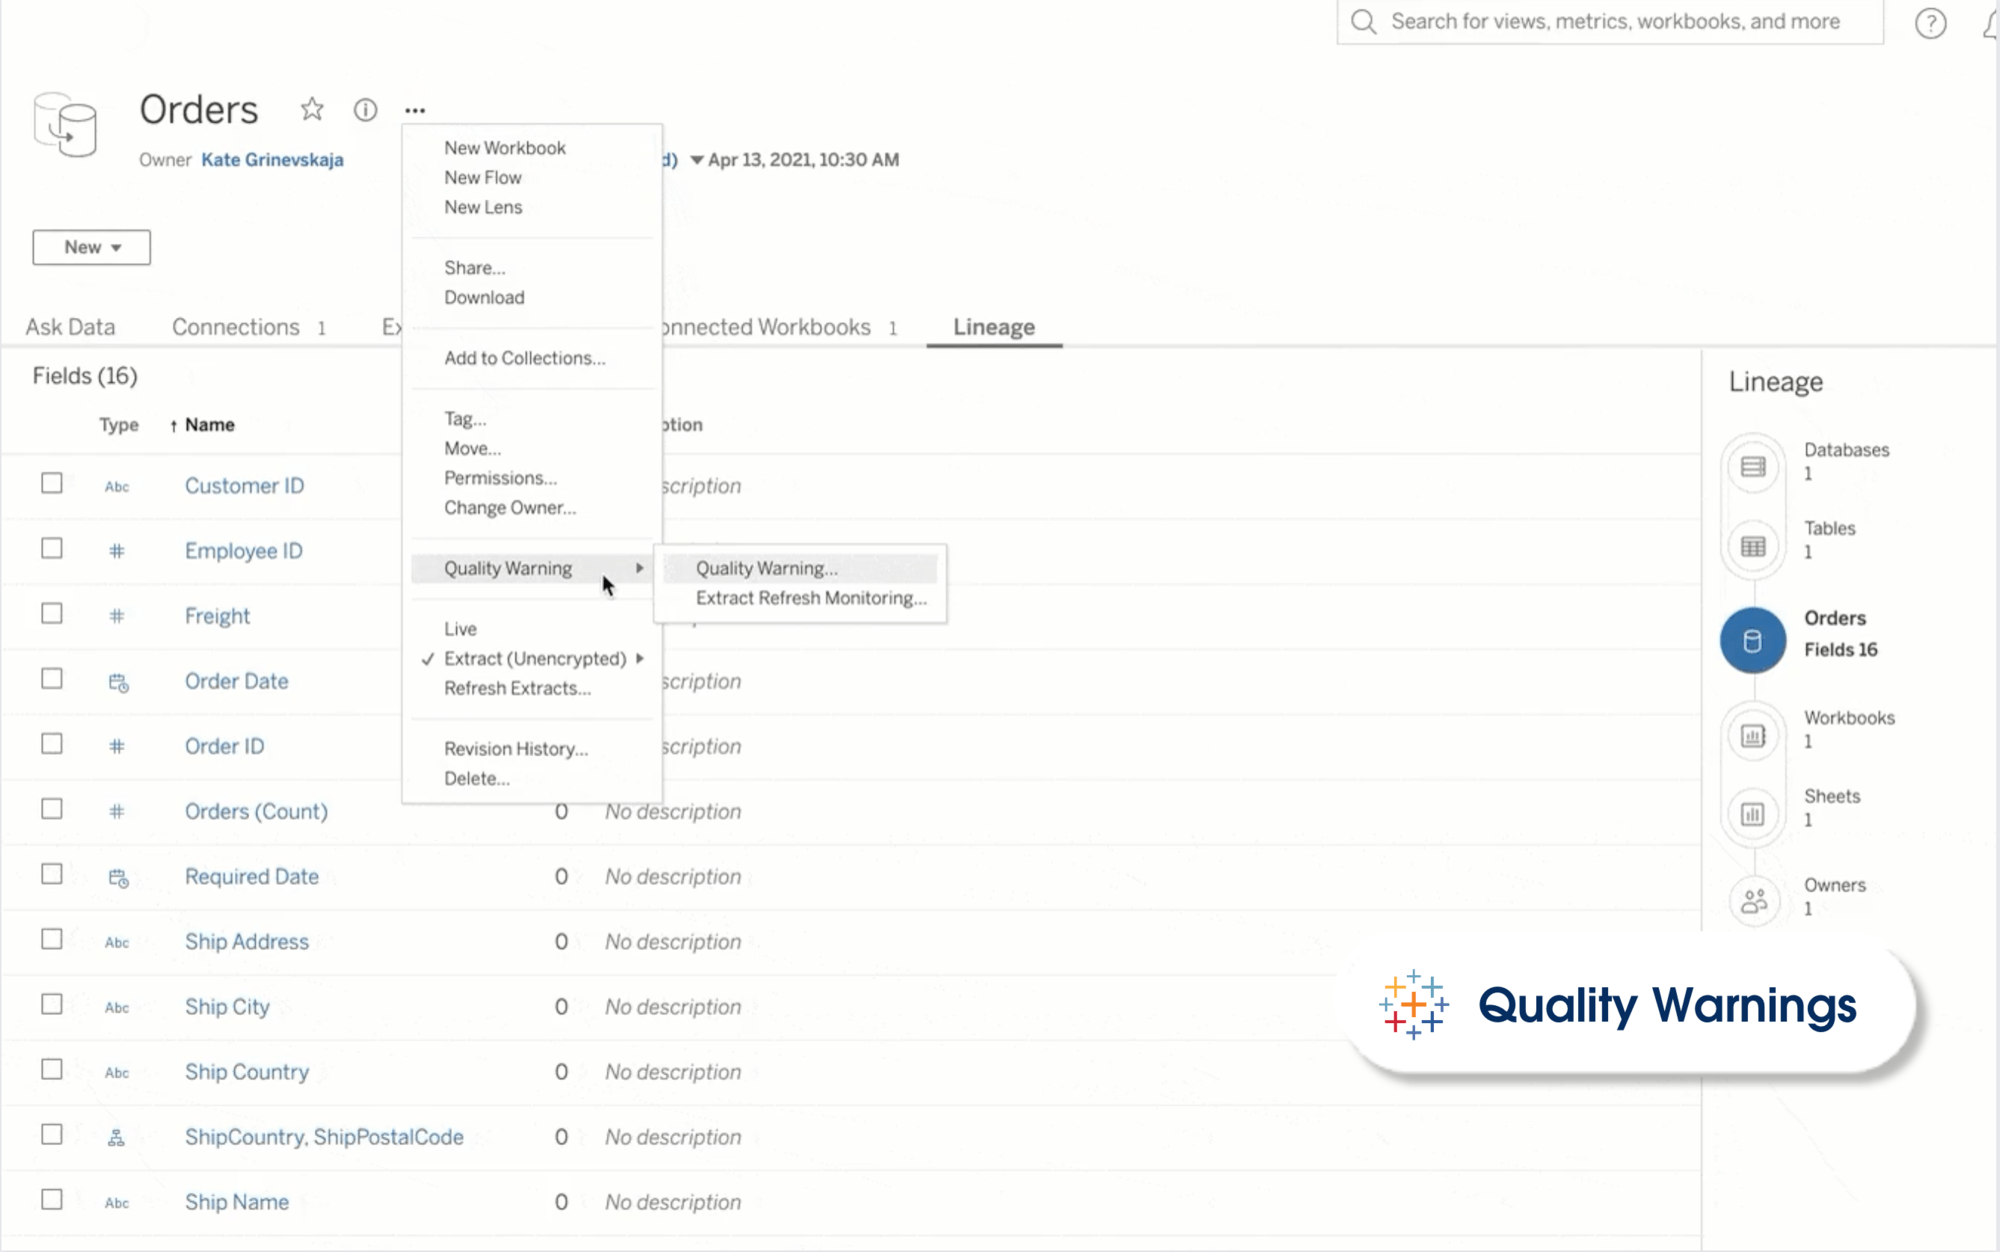
Quality Warnings
Automated alerts on all your data assets
Quality Warnings is a feature of the Tableau Catalog that gives you automated alerts on data assets so that you can fix issues before they happen. You can set data quality warnings on data sources, databases, tables, flows, virtual connections, virtual connection tables, and columns. You can also use this to monitor events such as extract data source refresh failure and flow run failure.
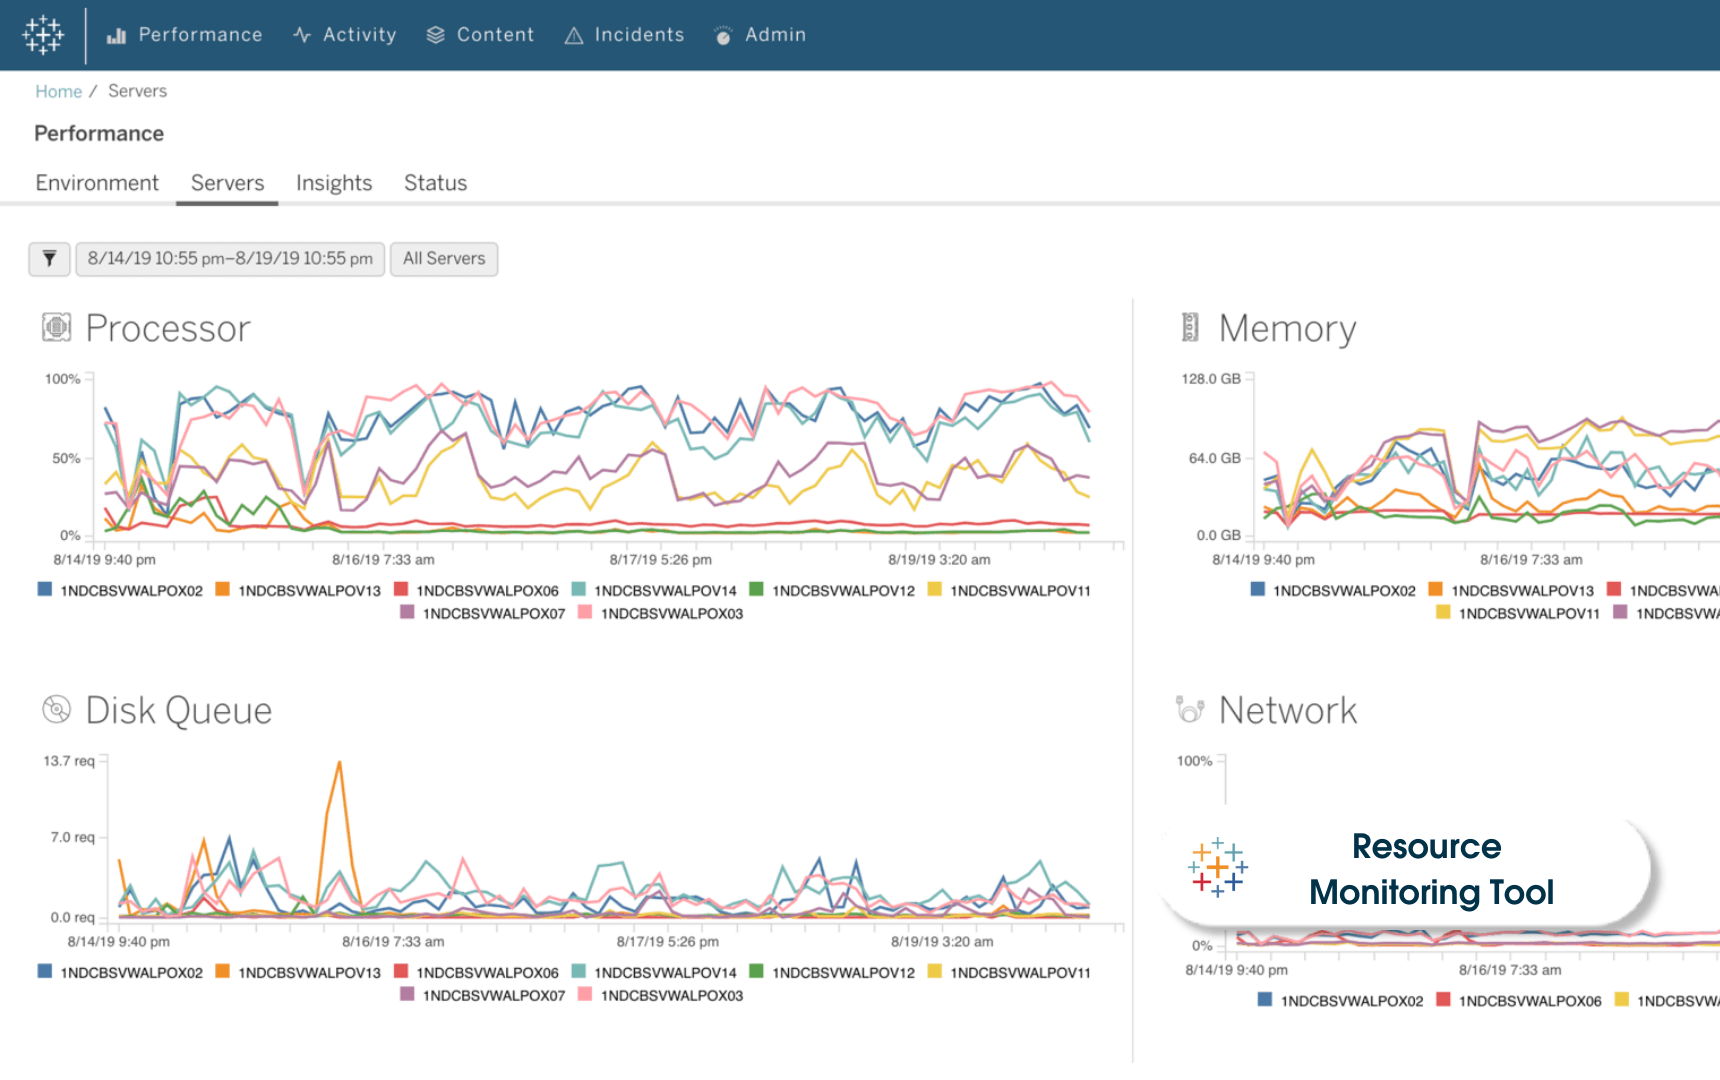
Resource Monitoring Tool
Monitor the Tableau environment at scale
Resource Monitoring Tool, which is usually called RMT, is a great tool to help you keep an eye on the health and performance of your Tableau Server installation. This tool collects data from your server, then tracks the health and performance of your Tableau Server installation. This tool works by collecting data from your server, and then it gives you a detailed overview of its current health status. With RMT, you can quickly diagnose the cause of slow load times, extract failures, and other critical issues that may impact the performance of your server. With this tool, you can monitor your server's performance and ensure it's running smoothly at all times.
Slack Integration
Unlock Productivity with Analytics
With native integration between the #1 analytics platform and the #1 productivity platform, you won't have to wait for a report or dashboard again. Through this integration, notifications and alerts from Tableau can be directed to Slack channels, enabling real-time updates about data changes and insights. Team members can easily share Tableau dashboards, visualizations, and insights in Slack, fostering immediate discussions and informed decision-making. You can actually deliver relevant, intelligent, and actionable insights in the flow of work and accelerate time to insight for everyone in your business.
Table Extensions
Infuse advanced analytics and predictions into your data
Raw data is valuable in its own right, but transforming it unlocks new possibilities and insights. To really unlock the full potential of your data, you need to be able to modify it with familiar tools before you analyze it in Tableau. Using Table Extensions, you can unlock new data and transform, augment, score, or otherwise modify your data using Analytics Extensions like Python, R, and Einstein Discovery. By adding rich data to Tableau's data layer, you can find deeper insights at the speed of business.
Unified Tooltip
Get more context for your in-shelf pills
The unified tooltips feature is a really helpful tool that lets users get up to six previous tooltips at once. This feature prioritizes information based on relevance, so users can quickly access the most important details. With this feature, users can easily identify the field name, table calc details, and field comments, all in one convenient location. Additionally, this feature provides context on error messages directly from a pill tooltip. Users can also quickly identify which worksheet’s filters are applied across. This unified tooltip is available for pills on all shelves, making it a versatile and valuable tool for users.
VizQL
The de facto query language for analytics
VizQL (Visualization Query Language) is a proprietary language used within Tableau's architecture to help translate user actions in the visual interface into queries and operations that retrieve, aggregate and transform data. By bridging the gap between visual design and data retrieval, VizQL lets users easily create interactive visualizations. It handles complicated operations and behind-the-scenes calculations to make helpful charts, graphs, and maps.
Workbook Optimizer
Implement performance best practices with ease
Workbook Optimizer is a tool that can tell you if a workbook follows certain performance best practices. It looks at critical design characteristics and compares them to best practices. The results page shows a prioritized list of concrete guidance, teaching authors how their workbook design affects performance. So, users can get the combined wisdom of Tableau product experts and our robust community without ever having to leave the platform.
Exchange
Extend your Tableau Platform
Tableau Exchange is an extensive online marketplace that provides a wide range of accelerators, connectors, and dashboard extensions to enhance your Tableau environment. By simply clicking a button, you can easily explore, search, sort, and filter through a vast array of offerings that cater to your specific needs. This incredible platform allows you to leverage the pre-built solutions from various data families, enabling you to extract maximum value from your analytics investment.
Year Over Year Growth
Quickly answer a common question with a couple clicks
Year-over-year (YoY) growth in Tableau involves comparing a specific metric or measure between two consecutive years. In Tableau, you use clicks, not complex calculations, to answer a common question: How does this compare to last year? And you get the answer in an instant.
Zoom and Pan Controls
Customize how people interact with data
Zoom and pan controls in Tableau are interactive functionalities that let you adjust the magnification level (zoom) and navigate around (pan) within visualizations. Zoom controls allow you to focus on specific details or get a broader view, while pan controls help you explore different areas of the visualization. These features make interactive data analysis more fun, letting you delve into specific data points, patterns, and insights within Tableau visualizations.
Relaterade berättelser

Extend Access to Embedded Tableau Content with On-Demand Access
 22 Juli, 2026

The Tableau+ Bundle with Premium AI, Enterprise Capabilities, and Premier Success
 24 Juni, 2026

What is Tableau Prep?
 30 April, 2026