
Top 10 Retail Dashboards for Better Performance
How can retailers use data visualization for better outcomes?
It’s no secret that business intelligence is having a massive impact on retail and consumer goods organizations. Retailers are rapidly turning to analytics to scale and develop competitive advantages and they’re using data visualization and interactive dashboards to create massive business value. In this whitepaper, we’ve curated ten types of dashboards leading retailers are using to do more with data and step-by-step guides on how to use them.
Below is an excerpt from the paper for you to interact with. Simply click on each dashboard to dive into the data and discover more.
To interact with all ten dashboards, we encourage you to download the full whitepaper.
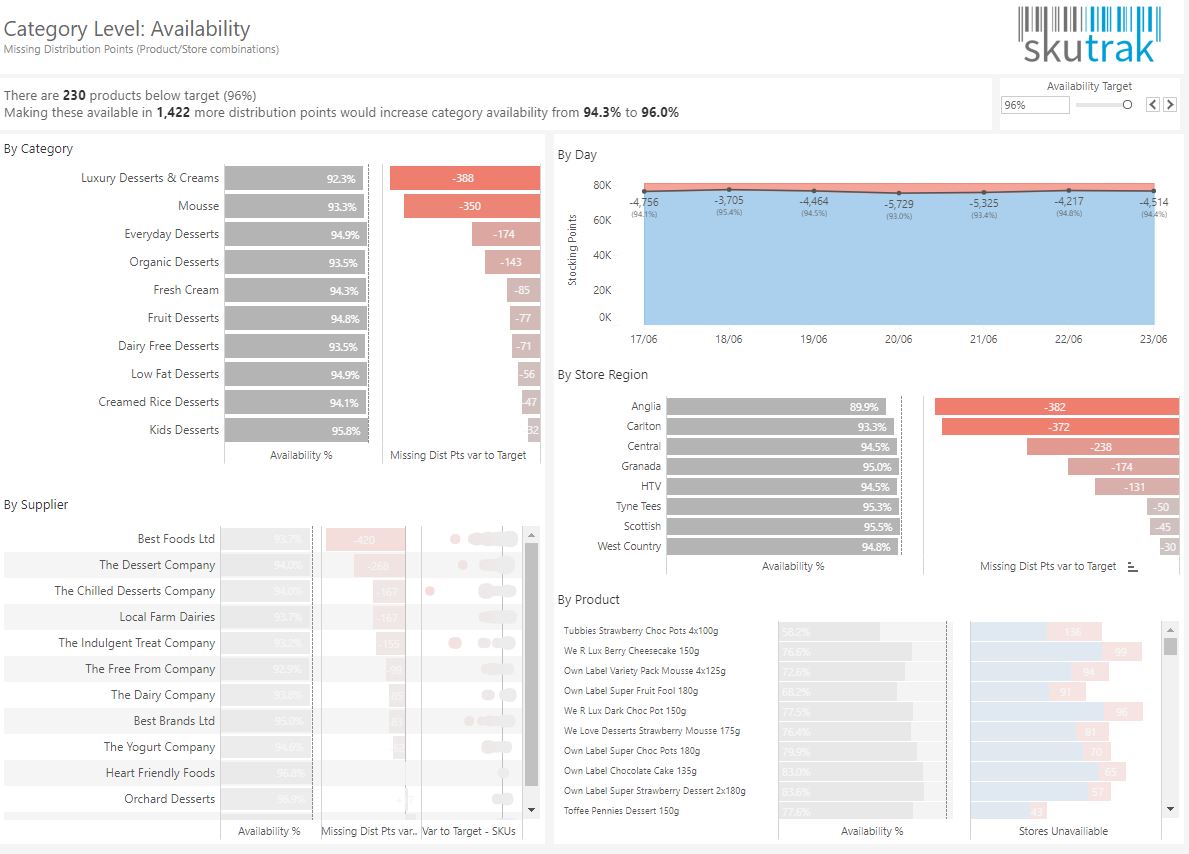
Product availability
This dashboard, from a leading grocery store retailer, aims to solve the problem of having the correct product, at correct inventory levels, in the correct stories. By analyzing product availability by category, supplier, day, and store region, retailers can identify gaps in efficiency and interactively drill into the details.
Explore the Dashboard
You’ve got the power of now. It’s that proximity and in-the-moment thinking that retail is all about.
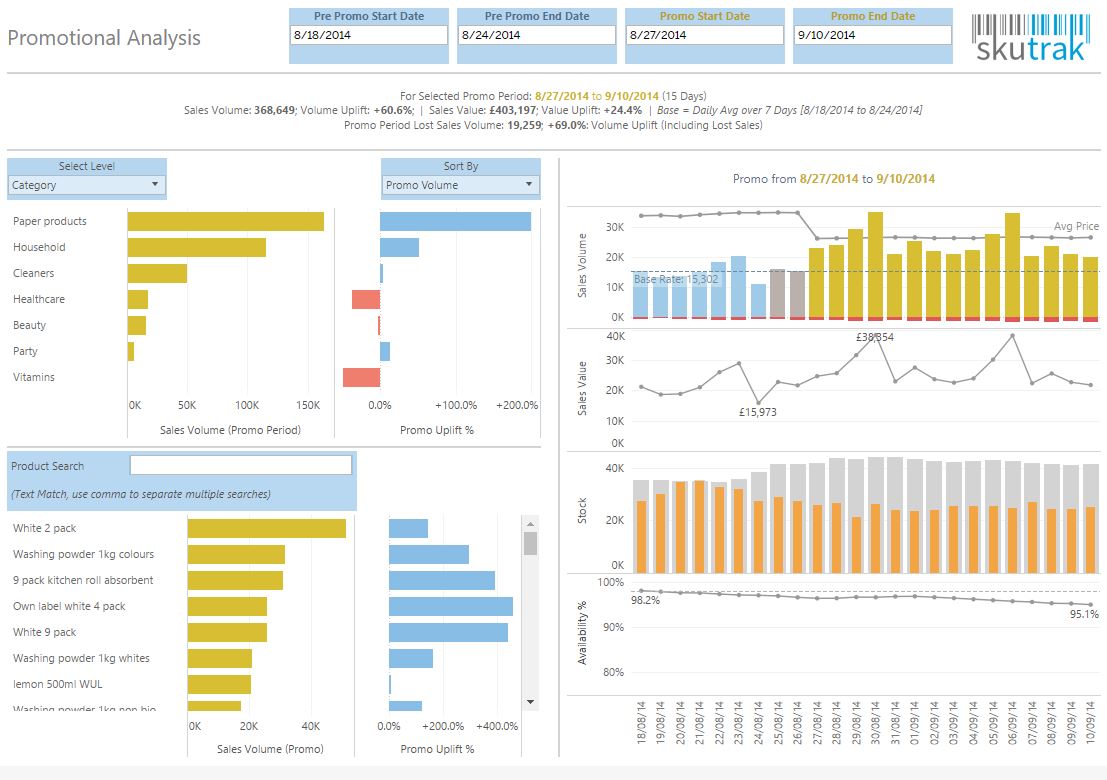
Promotional optimization
More than half of all retail sales are made during promotions, so it’s important to be able to visualize data during each phase – pre-promotion, the promotional period itself, and post-promotion. This dashboard shows retailers exactly what’s happening throughout the promotional cycle so they can prepare for availability issues by highlighting potential inventory stock shortages.
Explore the dashboard
At Coke Consolidated, mobile is key. We try to make sure our sales force is not stuck in the office, because we're primarily responsible for selling the product. And spending time in an office looking at metrics, crunching numbers is not their job. Their job is to sell product.
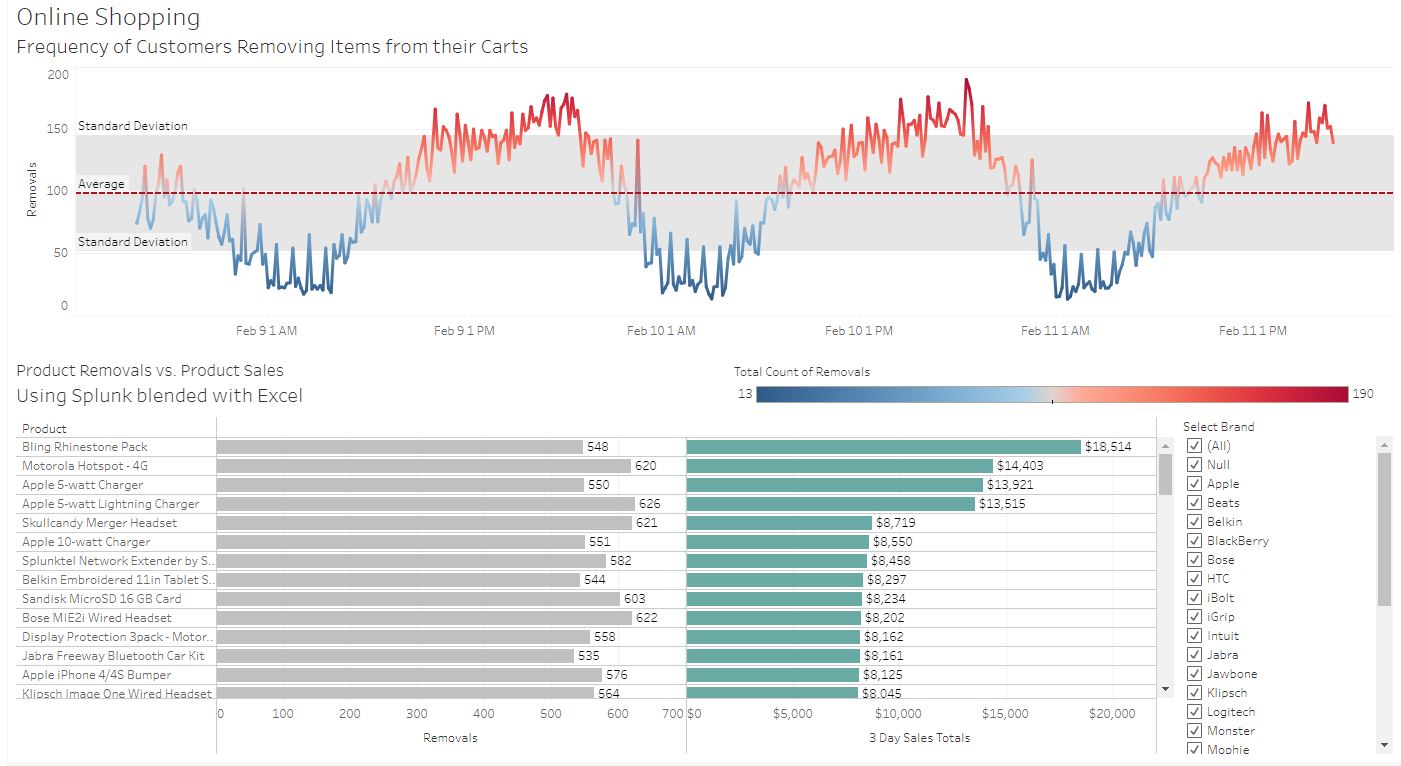
Online shopping cart analysis
In today’s digital marketplace, understanding online shopping cart behavior is critical for retailers. Dashboards can help retailers analyze how traffic sources, marketing campaigns, the behavior of specific customer segments, and other variables affect shopping cart habits. This online shopping cart analysis describes the frequency of customers removing items from their cart.
Explore the dashboard