Tableau Public’s Viz Wrap: Interesting Data Visualizations from 2022


Most weekdays, the Tableau Public team features a Viz of the Day that showcases how to see, understand, and share data insights using Tableau. We love the conversations these vizzes spark and enjoy shining a spotlight on the creativity and curiosity of the Tableau Community. There’s nothing quite like the DataFam and Tableau Public is where it all comes together.
2022 was a year of growth and change, challenges and celebrations and as it comes to an end, let’s take a look back at just a small fraction of the thousands of interesting data visualizations—beyond Viz of the Day—created by Tableau Public authors around the globe this year. From business dashboards to pop culture, and health care to world events, explore 100 vizzes that highlight what the #DataFam vizzed about throughout the year. Make sure to follow your favorite authors and favorite the ones you like the most.
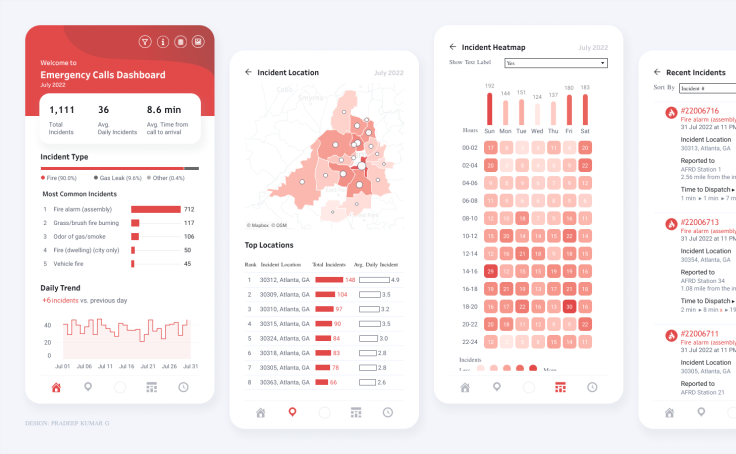
Emergency Calls Dashboard | Mobile View
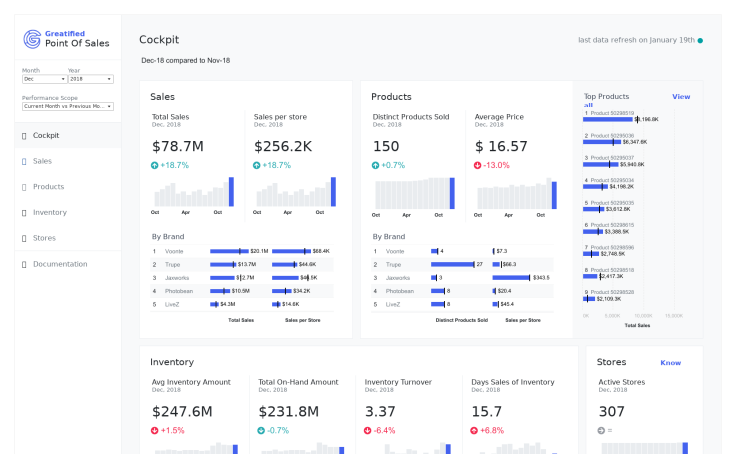
RETAIL - POS - Point of Sales Dashboard - Redesign

Billie's Craft Beer Fest 2022
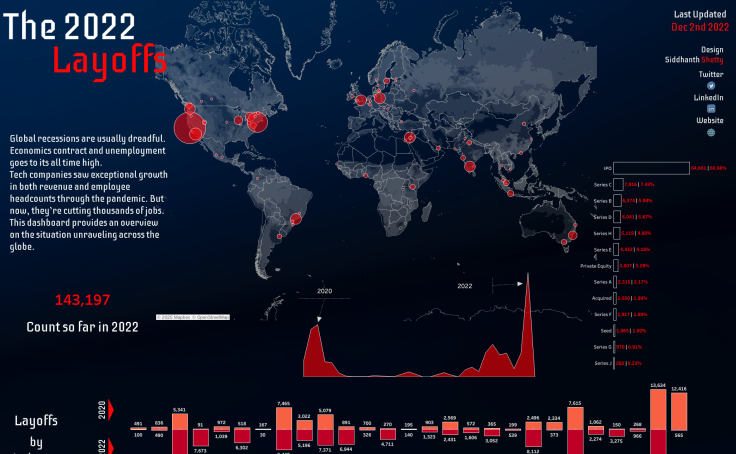
Layoffs of 2022
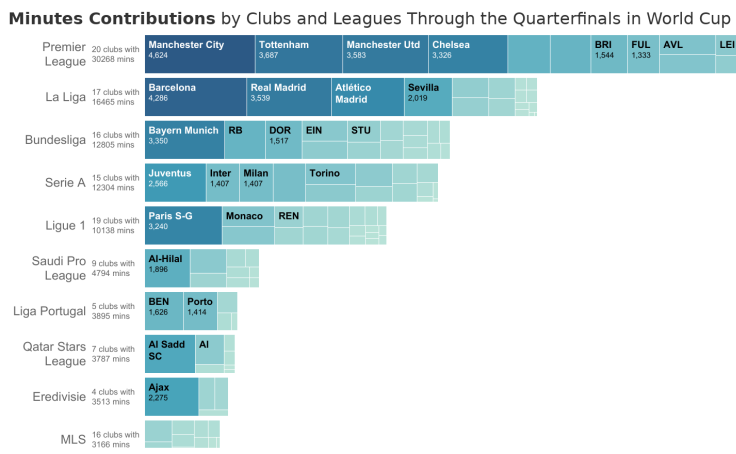
World Cup 2022 Minutes Contributions
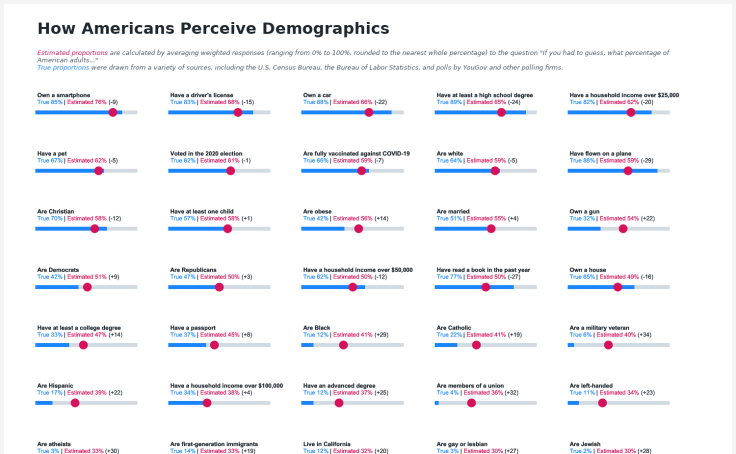
MoM2022 W49 | How Americans Perceive Demographics

Your Next Favorite Board Game

Demo: Help Desk (RWFD)
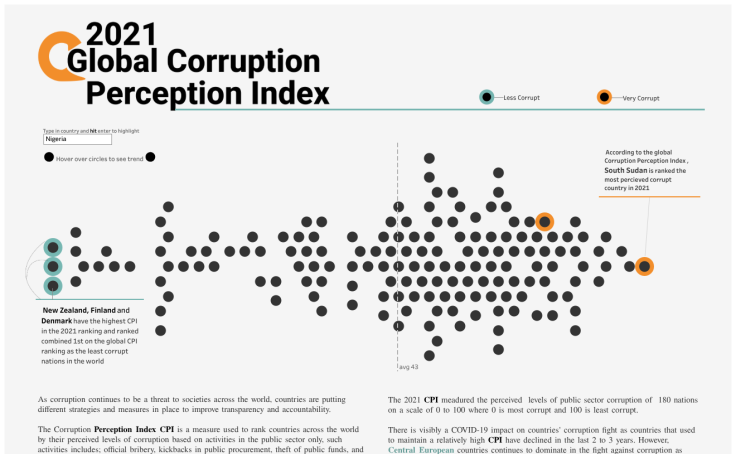
2021 Global CPI
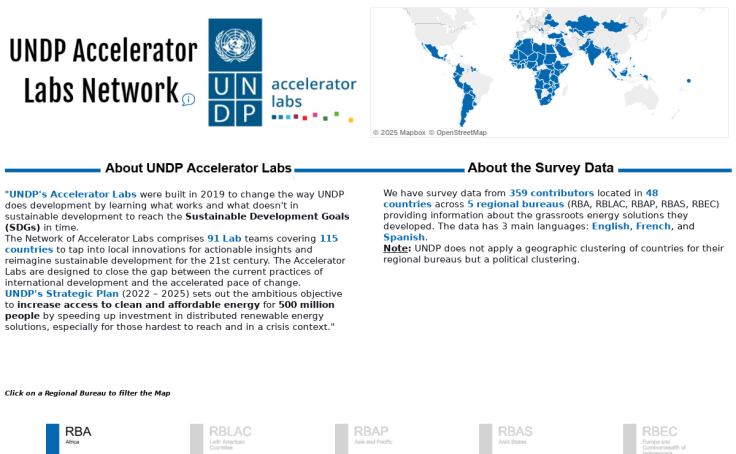
#VSFG - UNDP Accelerator Labs Network
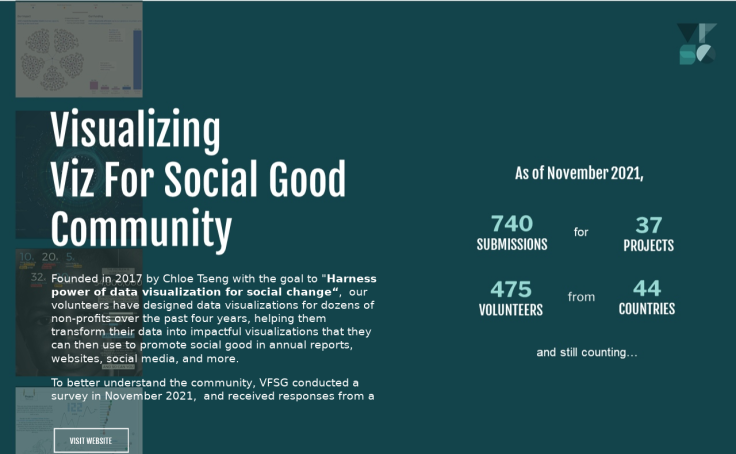
#VizForSocialGood - Community Survey 2021
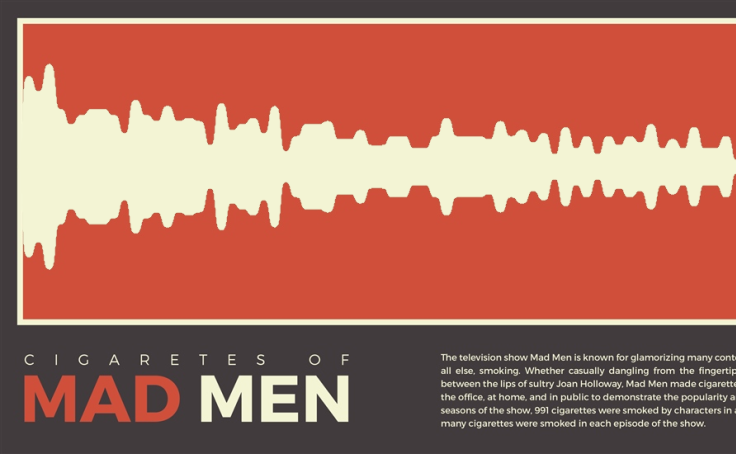
Cigarettes of Mad Men
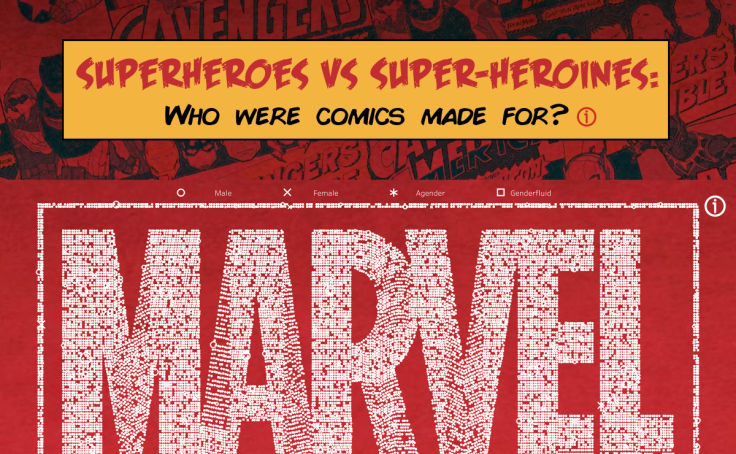
Superheroes vs Superheroines
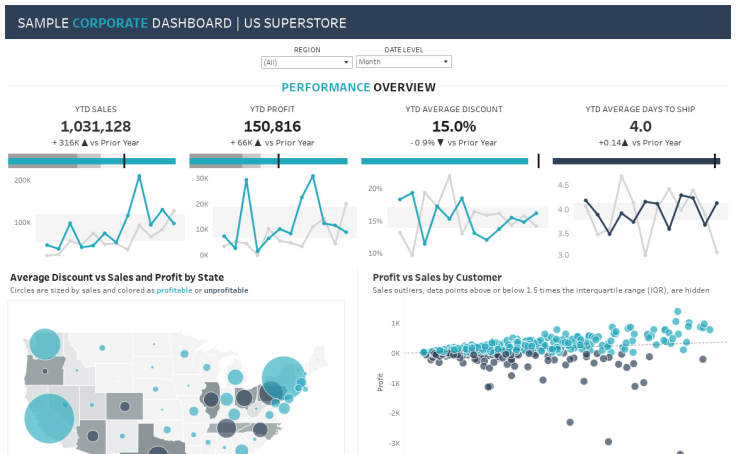
Sample Corporate Dashboard
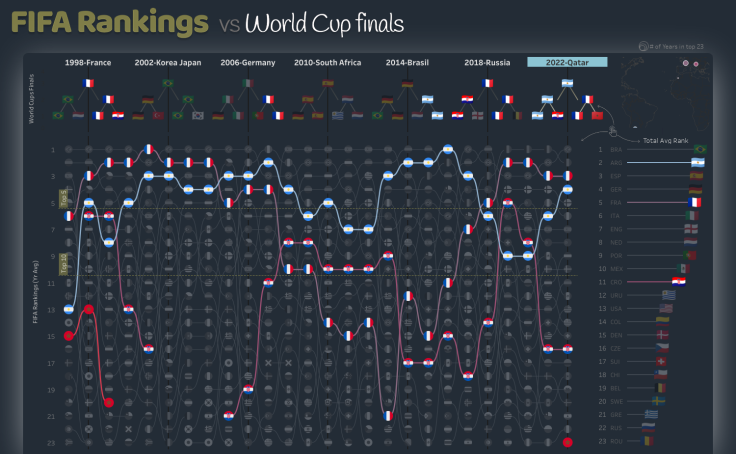
FIFA rankings vs World Cup Finals

The Changing Geography of Candy Land

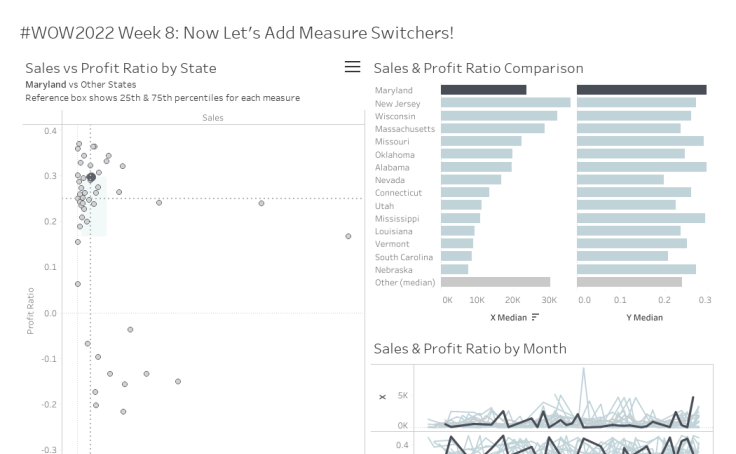
#WOW2022 - Week 8
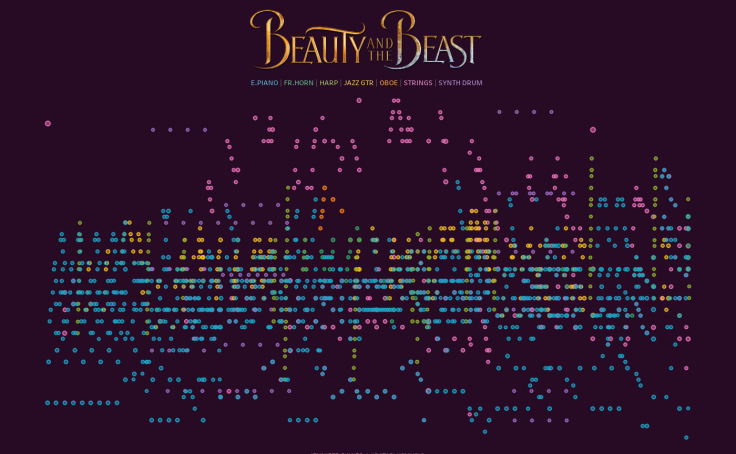
Beauty and the Beast
#B2VB Week1: Build a Scatter Plot
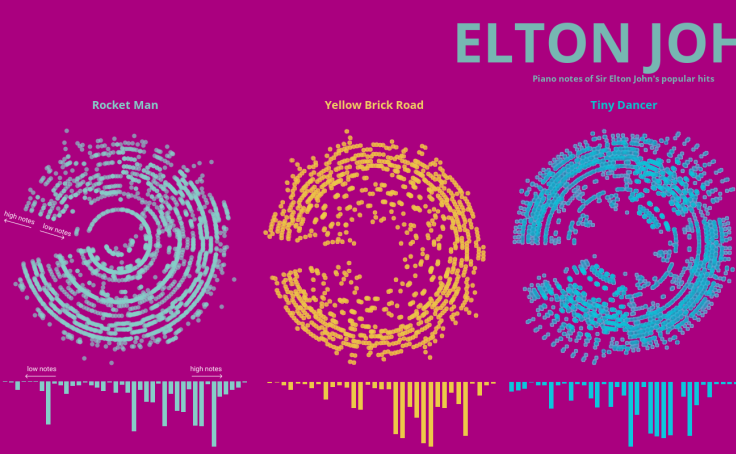
Elton John Favorites!
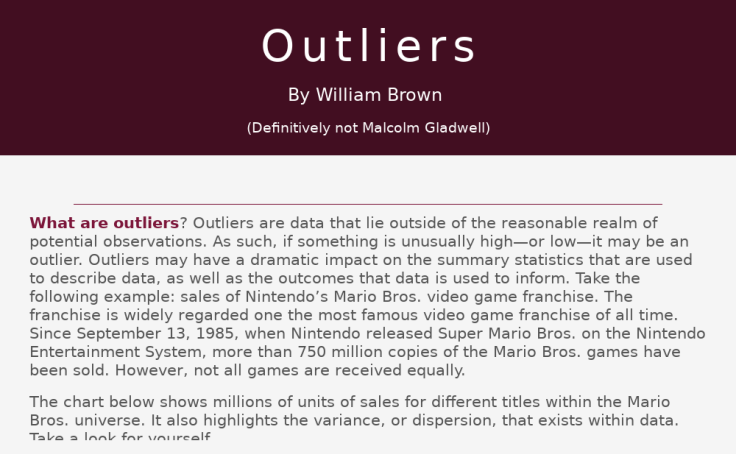
Outliers
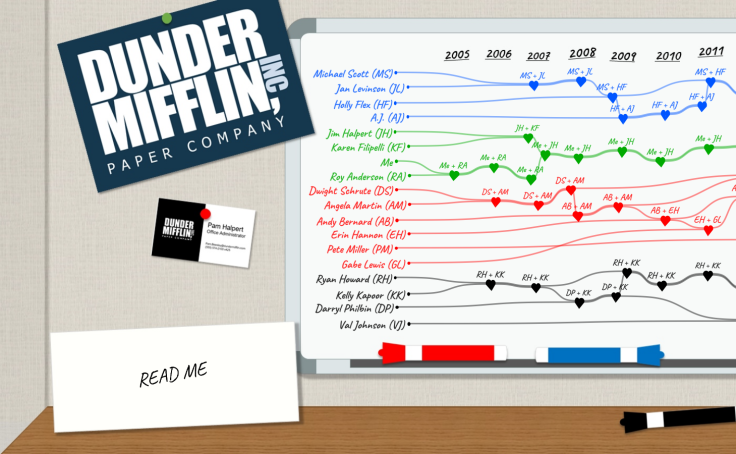
Office Relationships

Disney Domination of Best Animated Feature Award

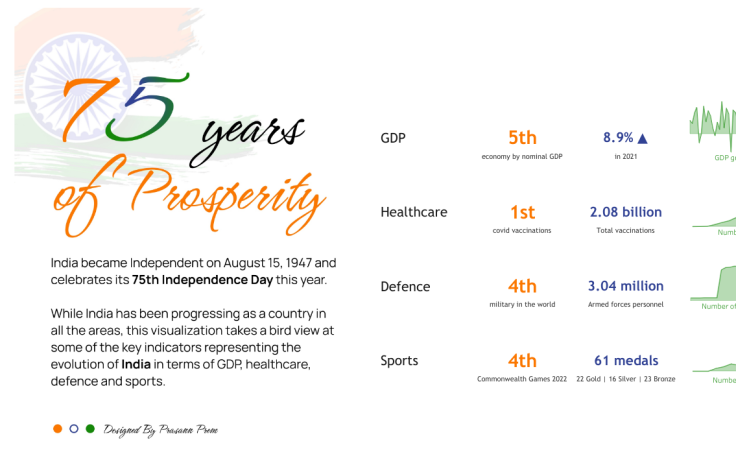
My Ode to Indian-ish (#IronViz-ish 2022)
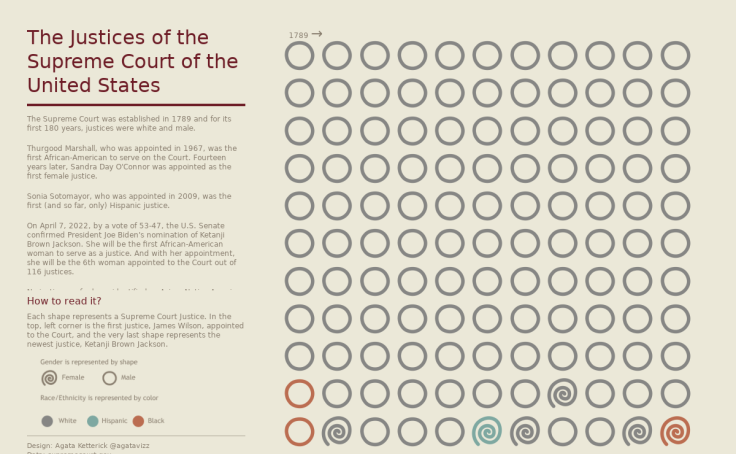
Supreme Court Justices

SportsVizSunday March Womens US Open Final

The Faces of Batman
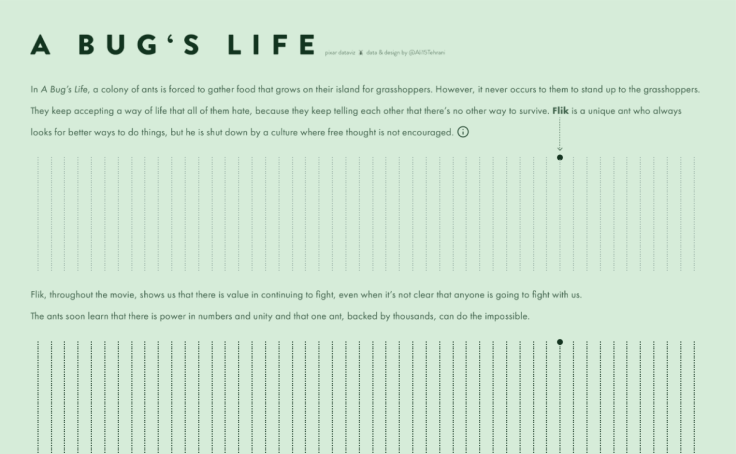
A Bug's Life | Pixar Dataviz

The Twin Film Phenomenon
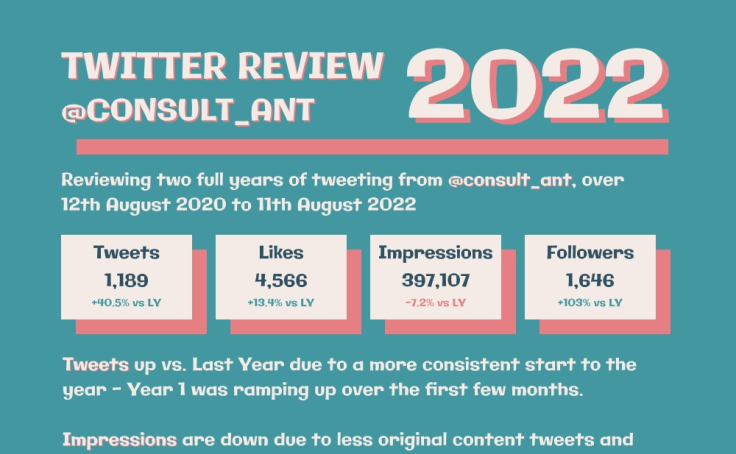
Twitter Review 2022 - @consult_ant
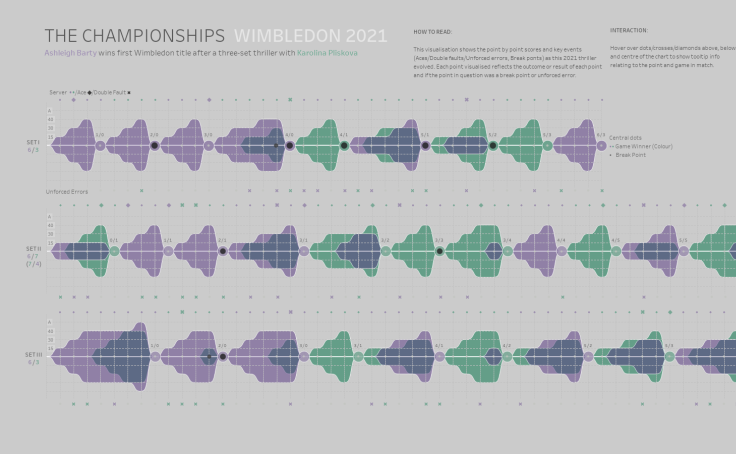
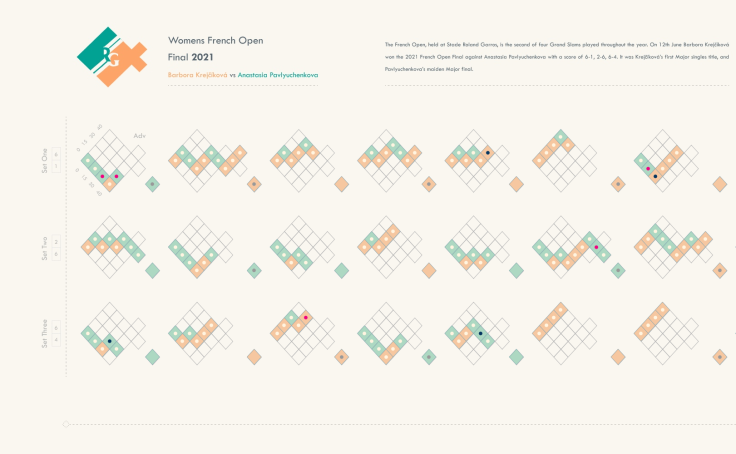
Wimbledon 2021 AB vs KP
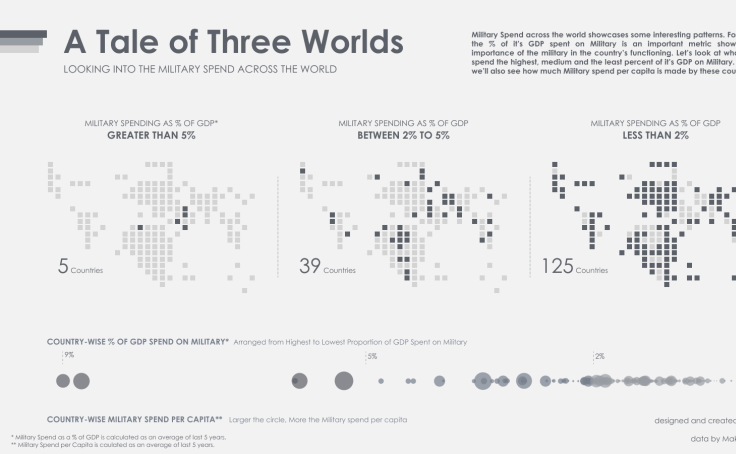
A Tale of Three Worlds
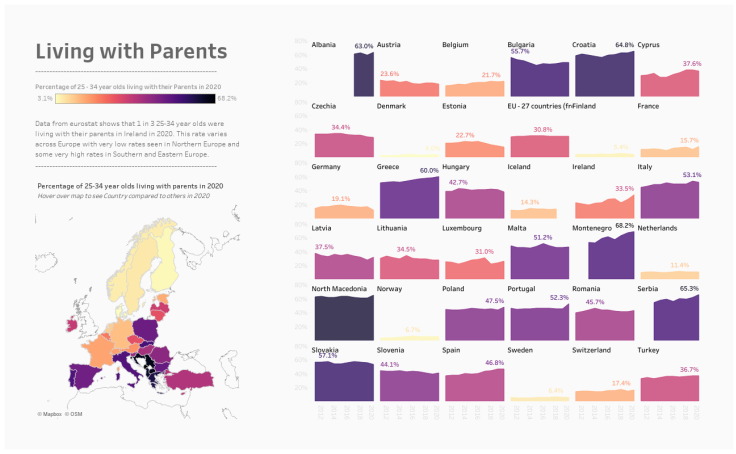
Living with Parents
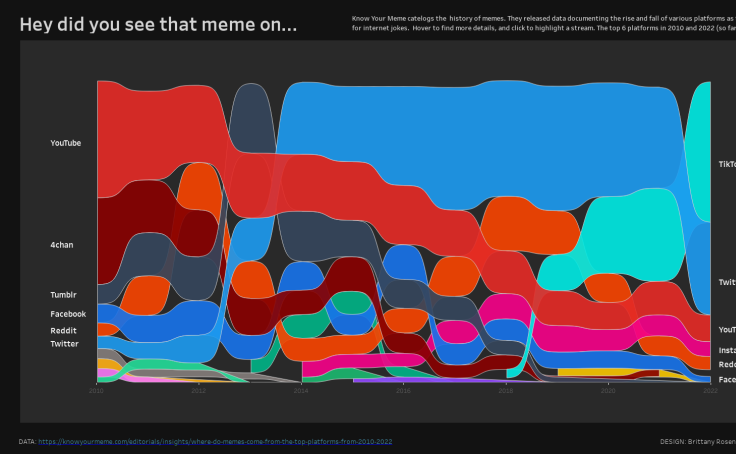
Know Your Meme History
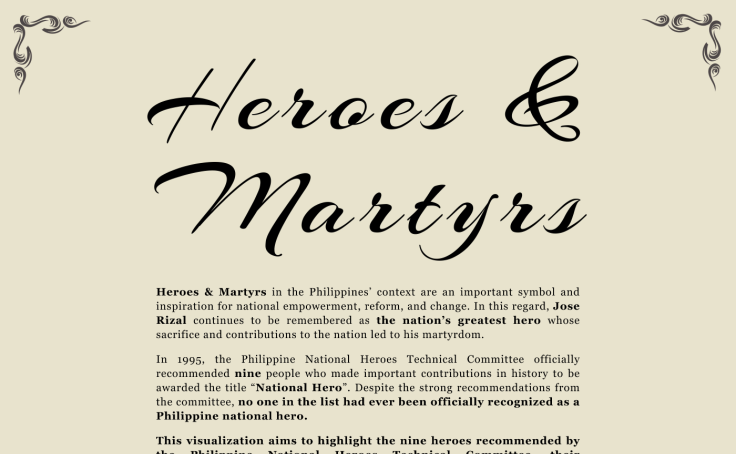
Heroes and Martyrs - A #VizCollab with Ervin Vinzon

Indonesian Cuisine and Cookies During Lebaran Festival
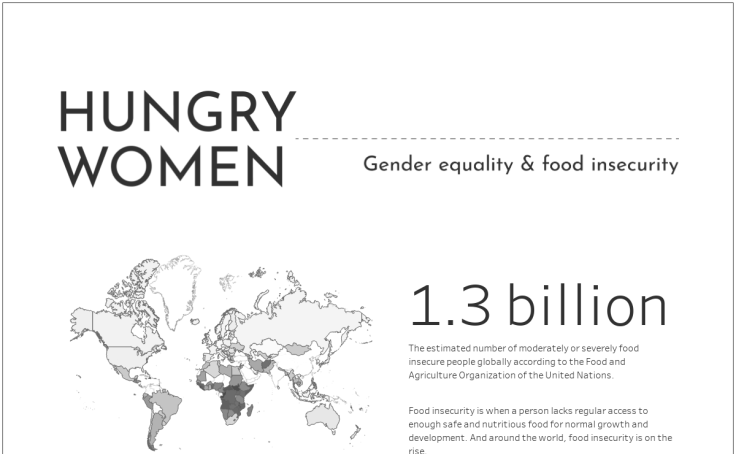
#DiversityInData | Hungry Women
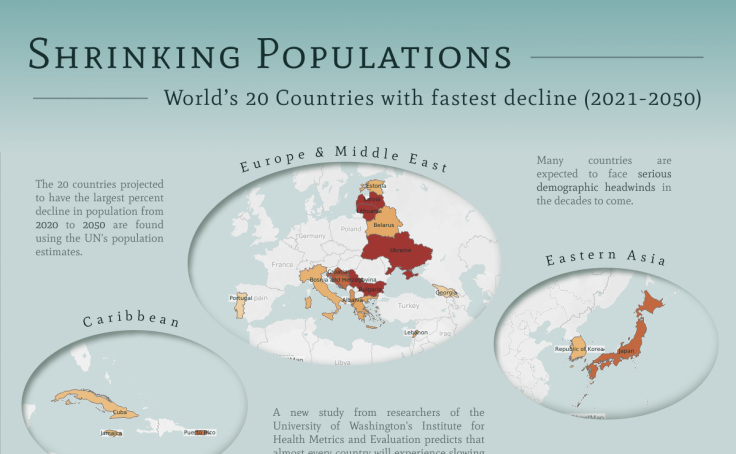
Shrinking Populations (2021-2050)
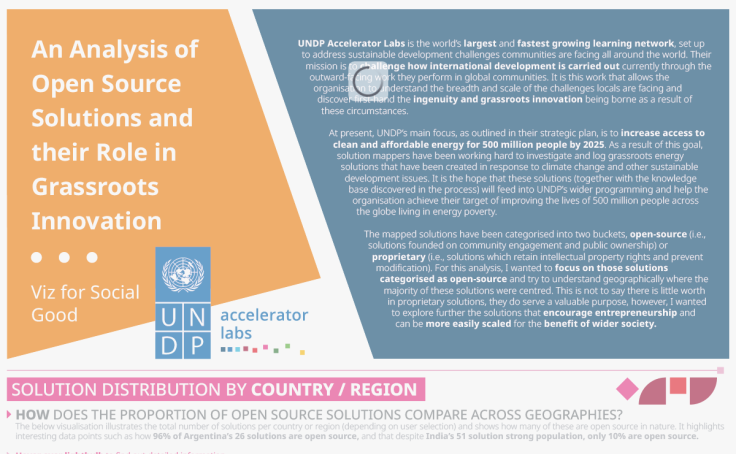
#VSFG | UNDP Accelerator Labs
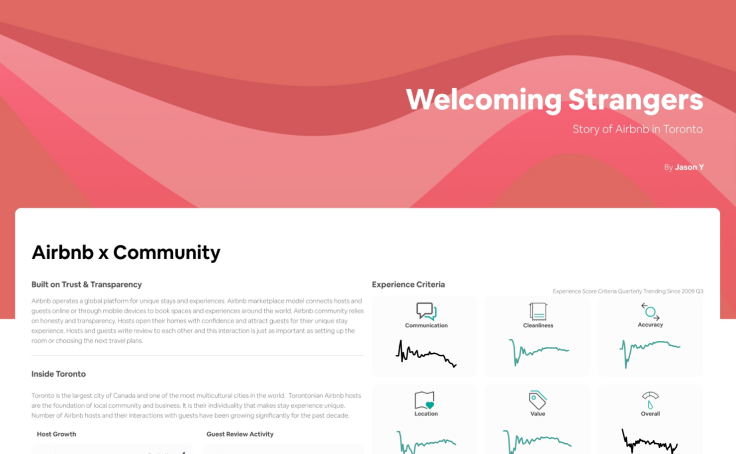
Welcoming Strangers
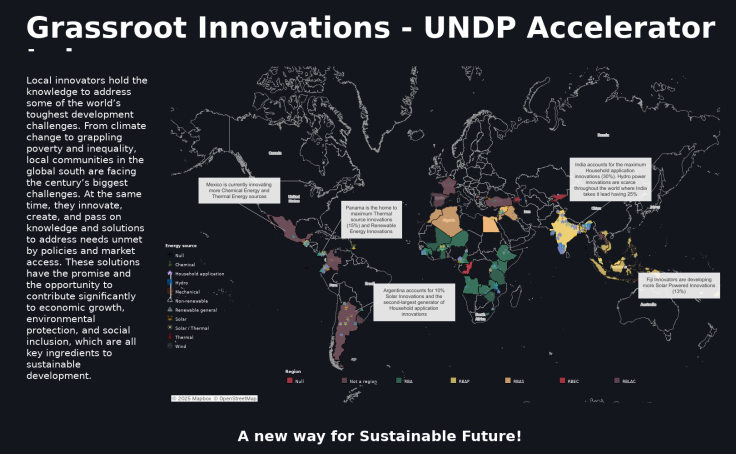
#VizForSocialGood Grassroot Innovations
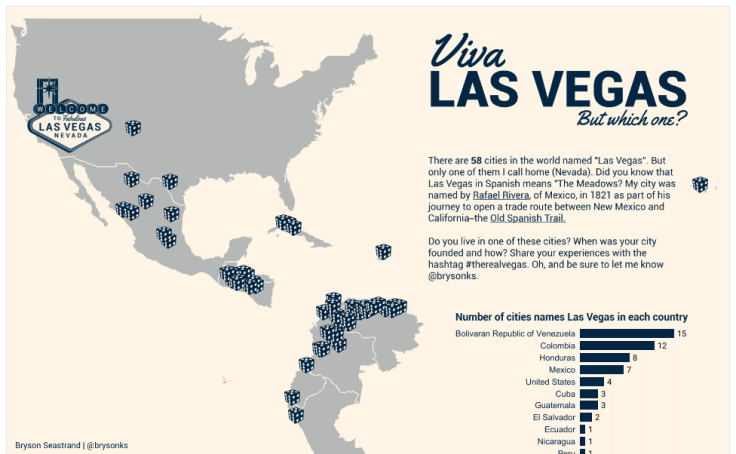
Viva Las Vegas...But which one?

FIFA World Cup/Germany History

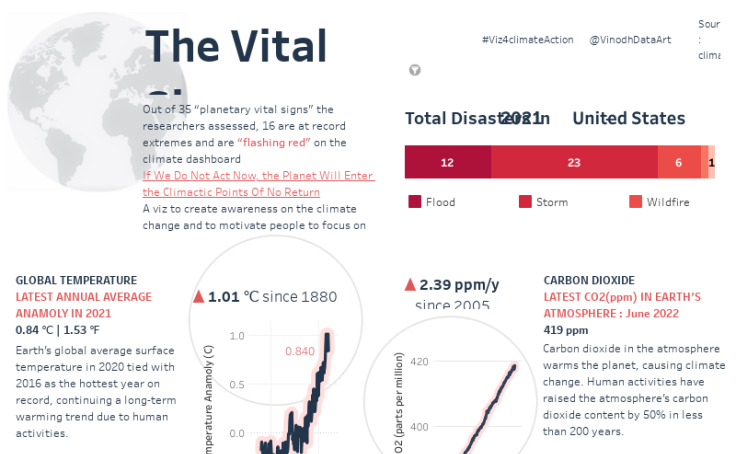
Vital_signs_of_the_planet - #Viz4ClimateAction

BBC Sports Personalities 1954 - 2021

Super Bowl Commercials Maven Analytics
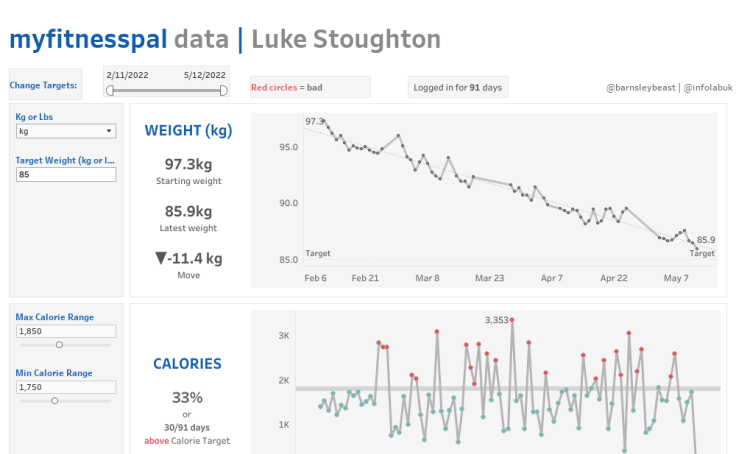
MyFitnessPal Dashboard
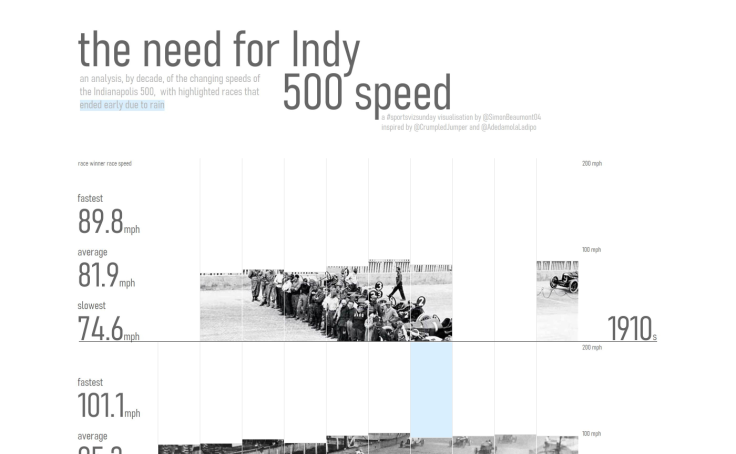
#SportsVizSunday - The Need For Indy 500 Speed

Radiohead | In Rainbows | Data+Music
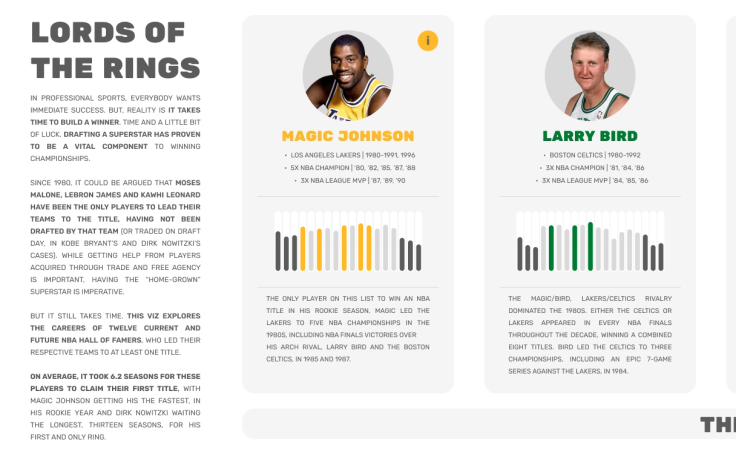
NBA Lords of the Rings
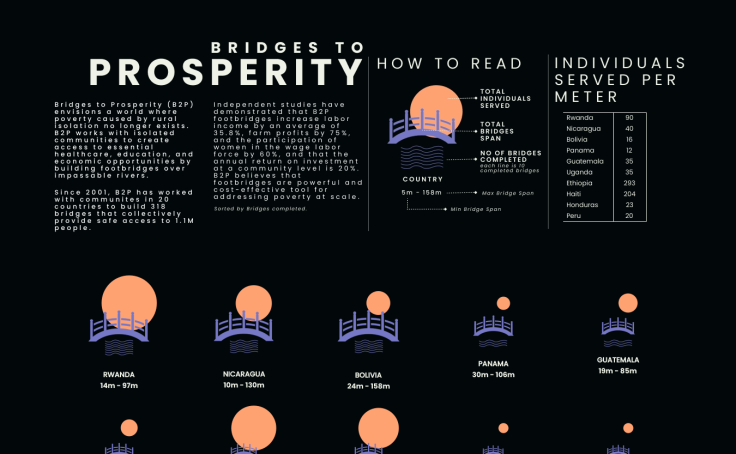
#MakeoverMonday Bridges to Prosperity
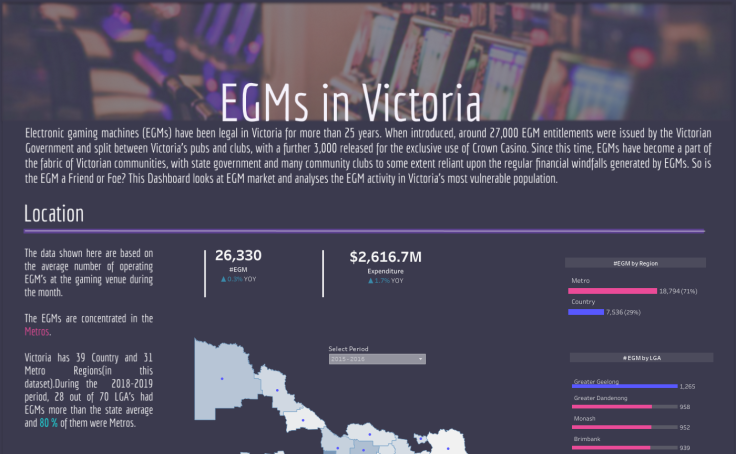
EGMs in Victoria
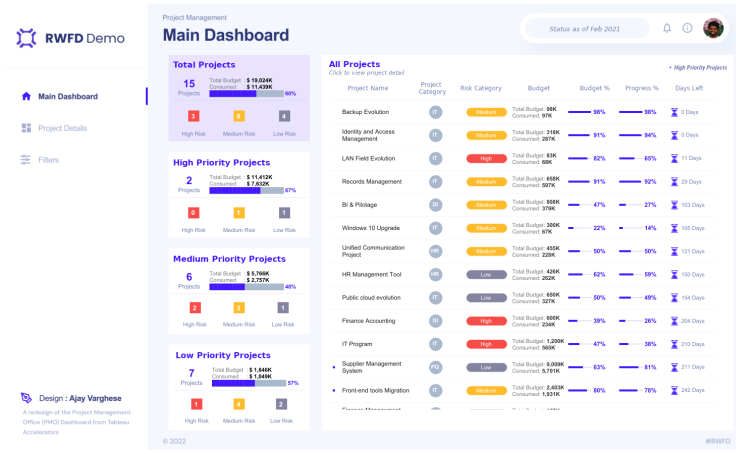
PMO - Project Management Dashboard #RWFD #Exchange
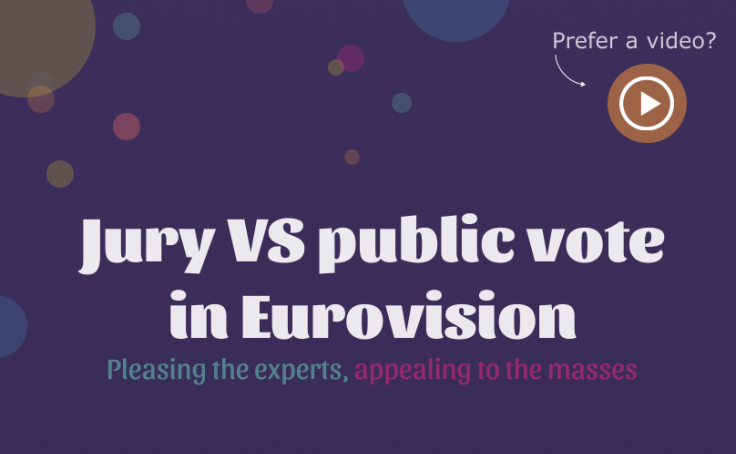
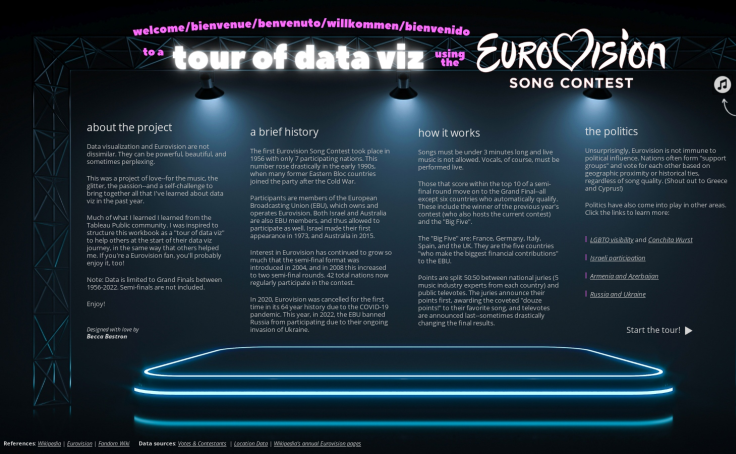
Eurovision: jury VS public votes, what are the patterns?
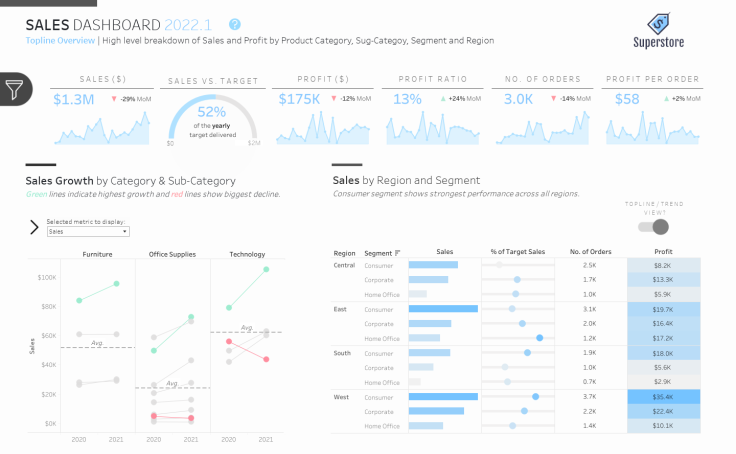
Superstore Sales Dashboard
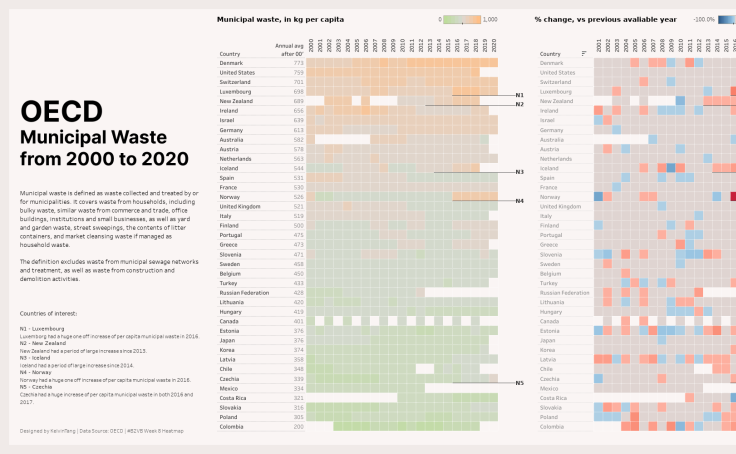
#B2VB | 08 Heatmap
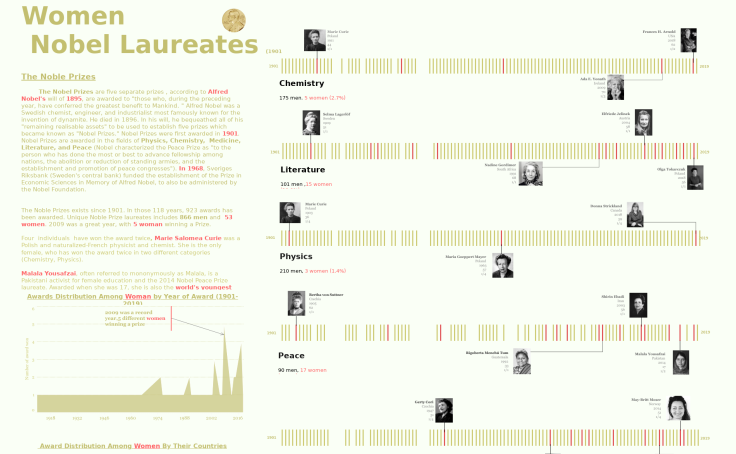
Women Noble Laureates (1901-2019) #ONYX Data Challenge
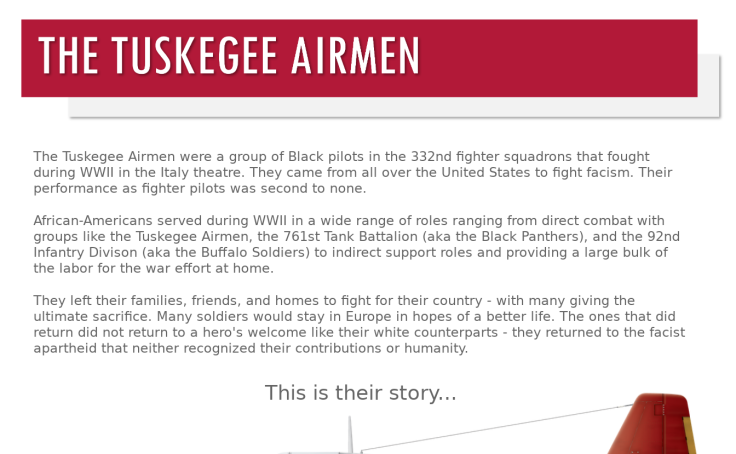
Tuskegee Airmen
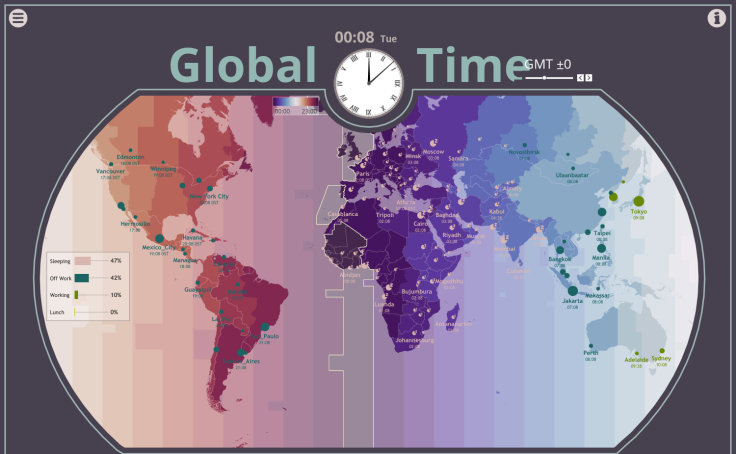
Global Time
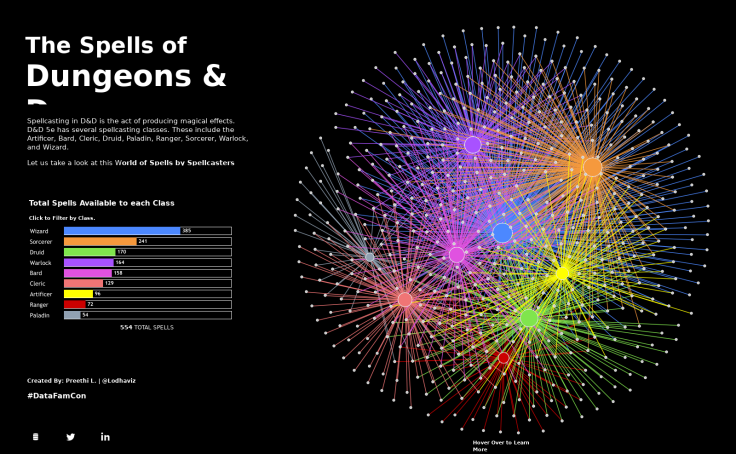
The Spells of DnD #DataFamCon
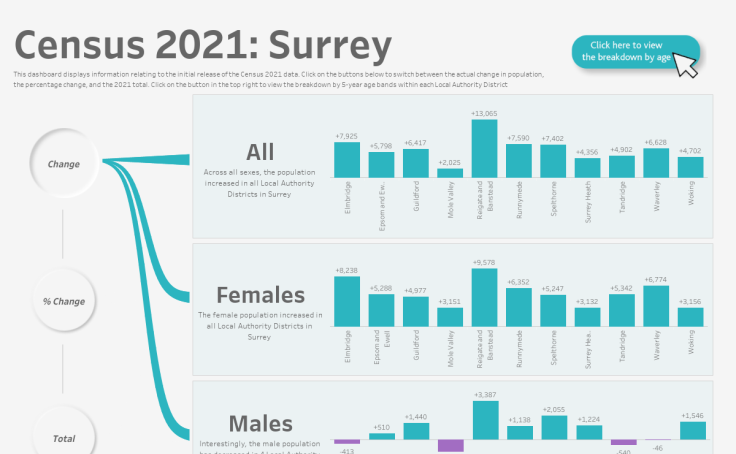
Surrey Census 2021
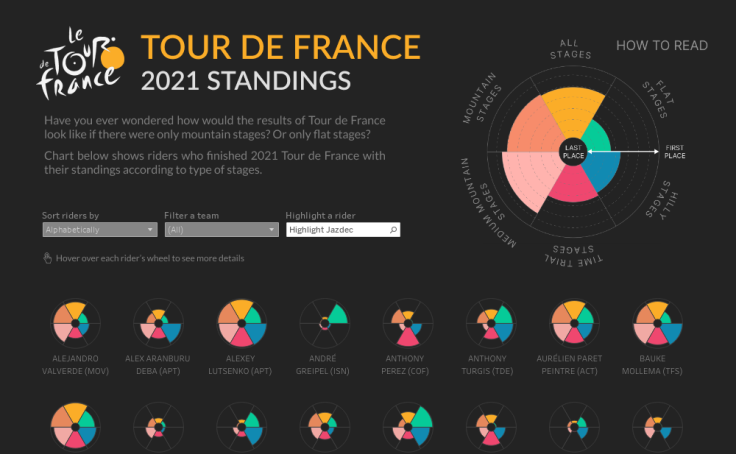
TOUR DE FRANCE | 2021 STANDINGS BY TYPE OF STAGE
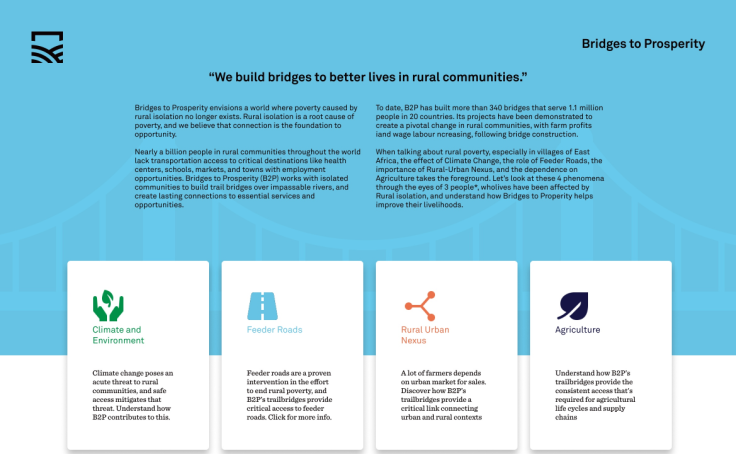
Bridges to Prosperity | #VFSG
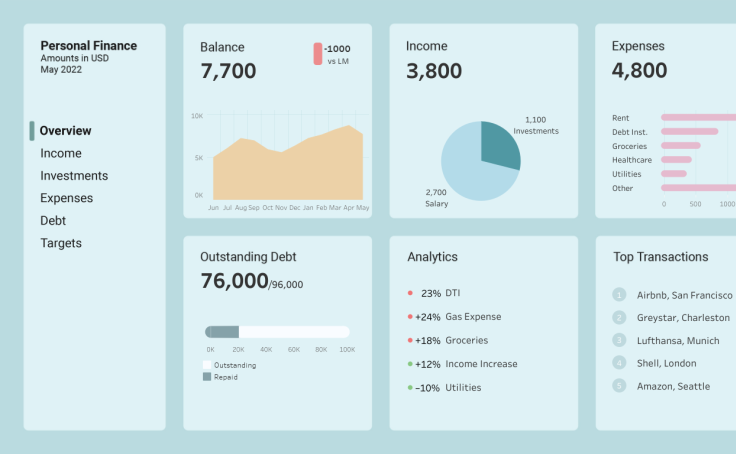
Personal Finance
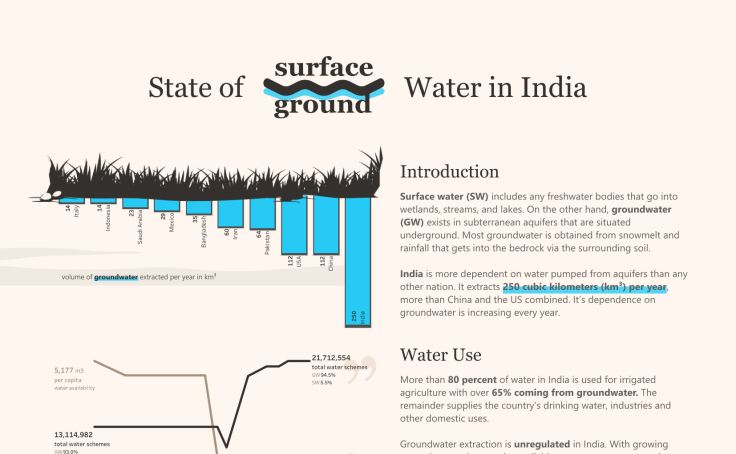
State of Water in India
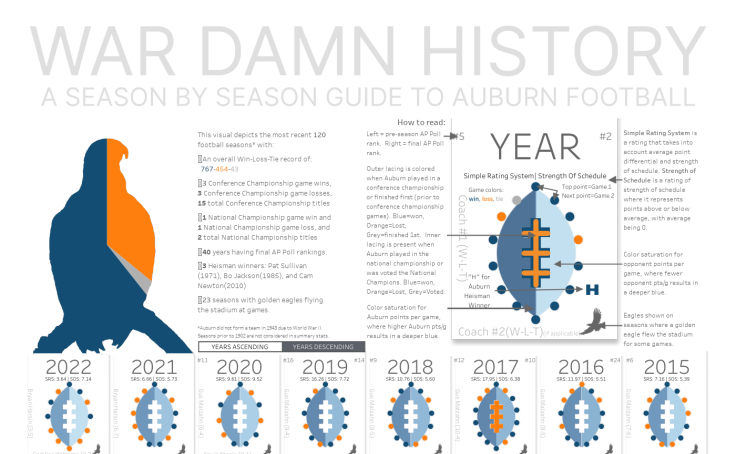
War Damn History

The Great Race of Mercy

#RWFD - NYC Community Service Requests
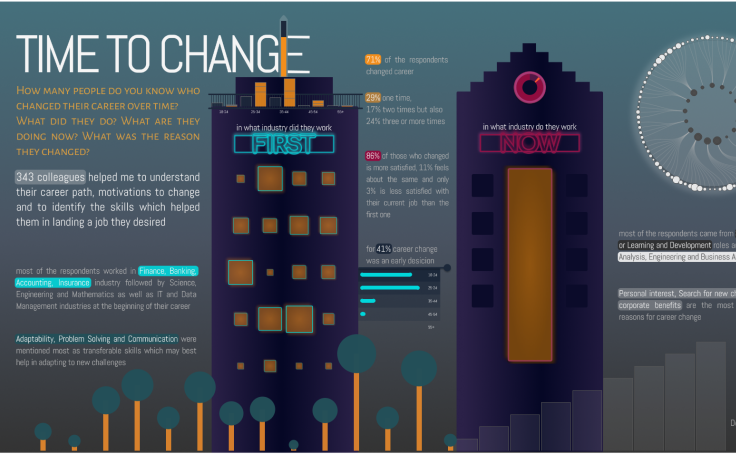
Time to change

This Woman's Work - Kate Bush | #DataPlusMusic
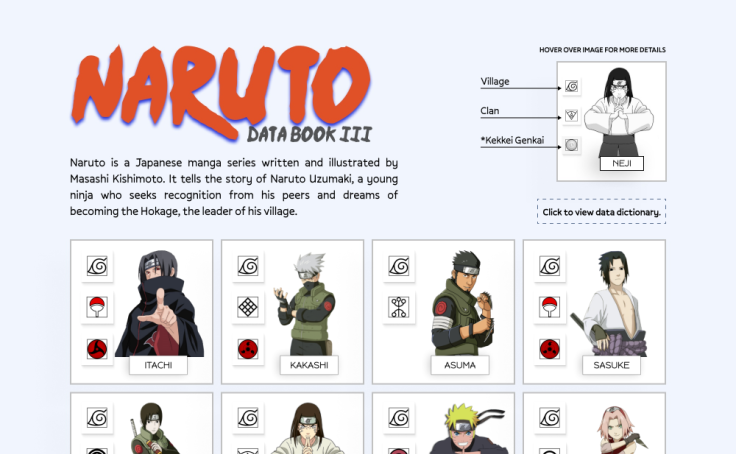
Naruto | Data Book
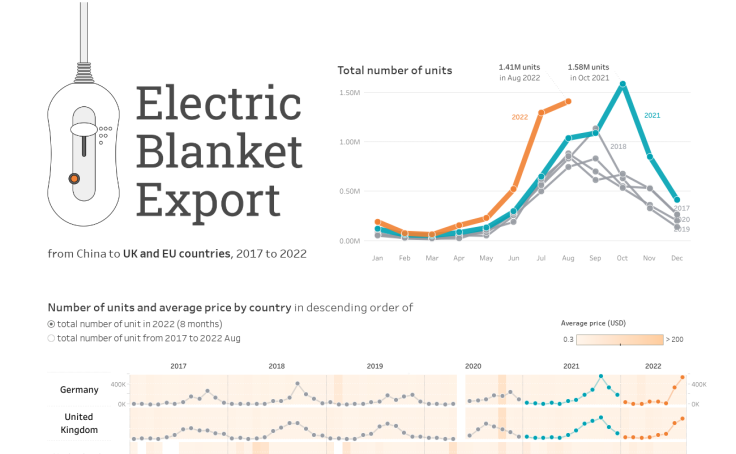
Electric blanket export

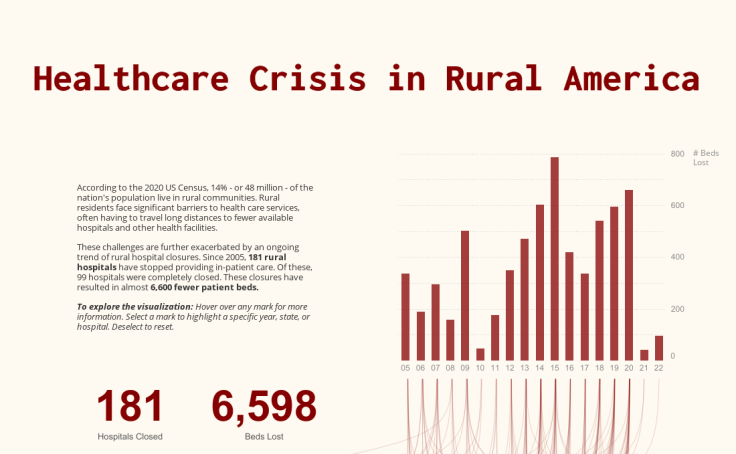
Health Care Professional Shortage #ProjectHealthViz
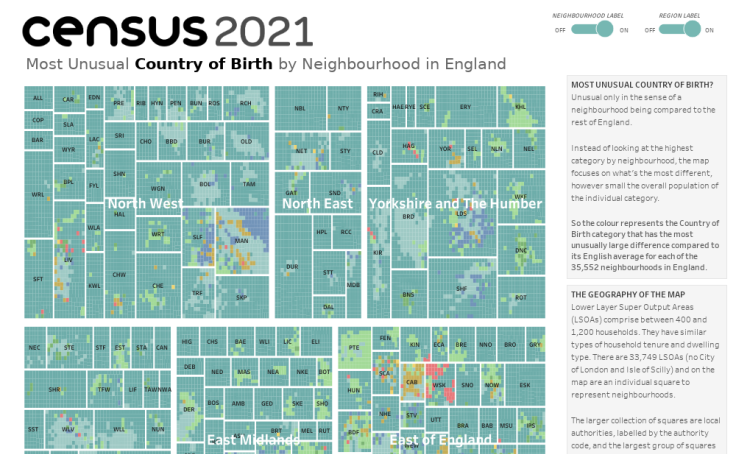
Census 2021 Country of Birth

Ukraine children who have died.
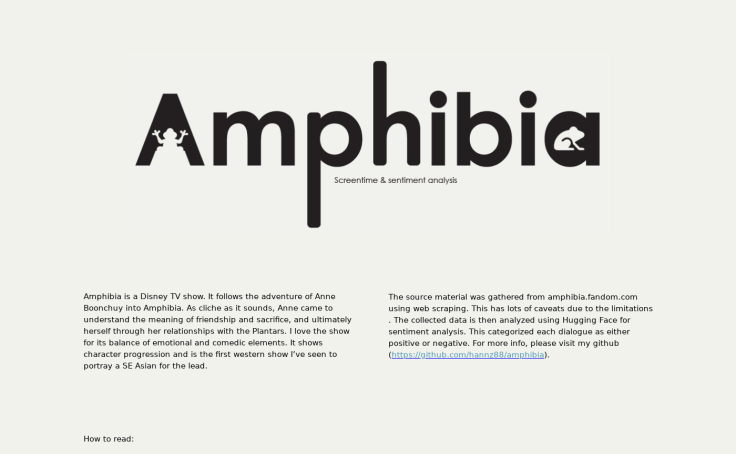
Amphibia

Pac-Man Fun Facts
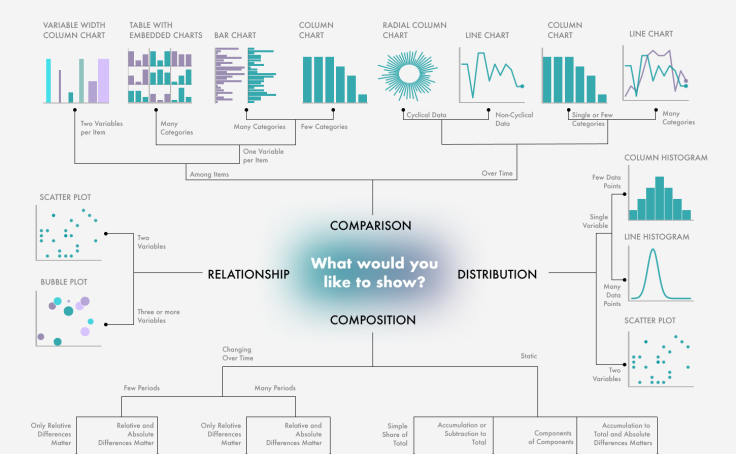
Chart Suggestions Guide
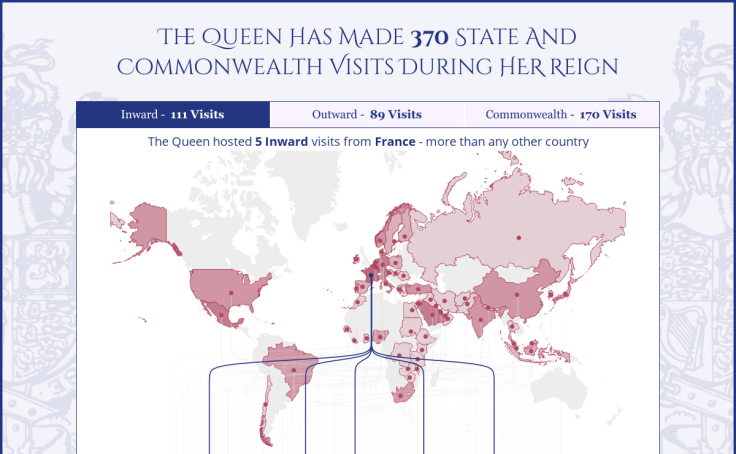
Royal Visits during the Queen's Reign

Star Trek: Every Single Episode
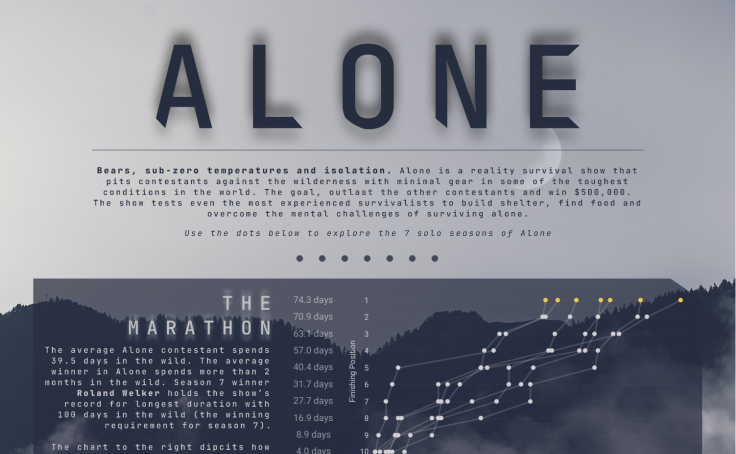
Alone
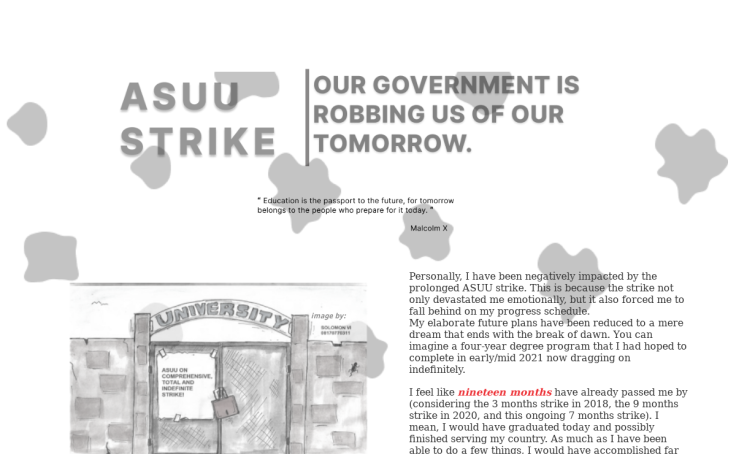
ASUU strike

Democracy Around The World 2021
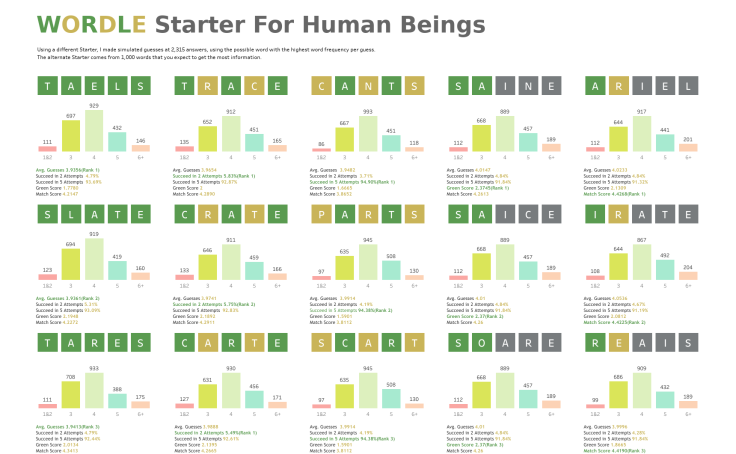
Wordle
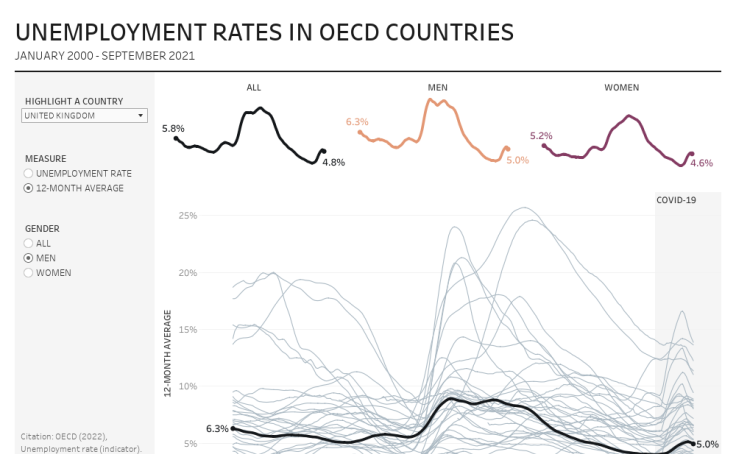
#B2VB - 2022/W2 - OECD Unemployment Rates
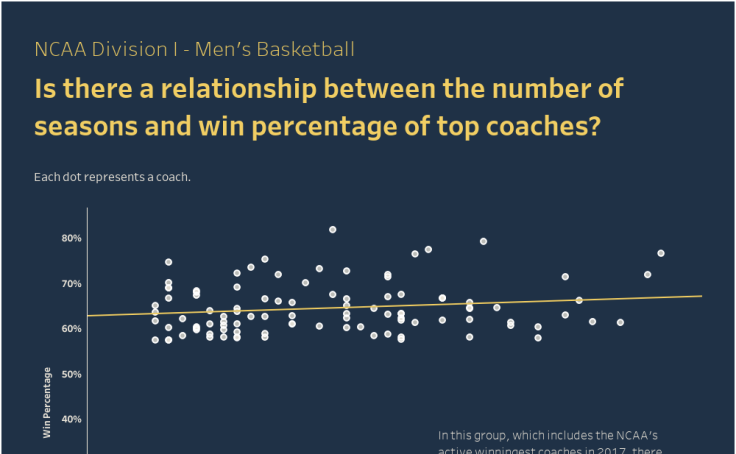
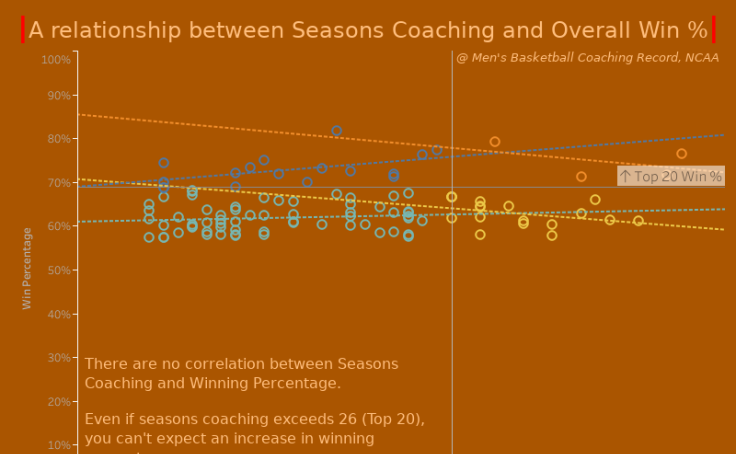
#B2VB Scatter Plot - NCAA Coaches
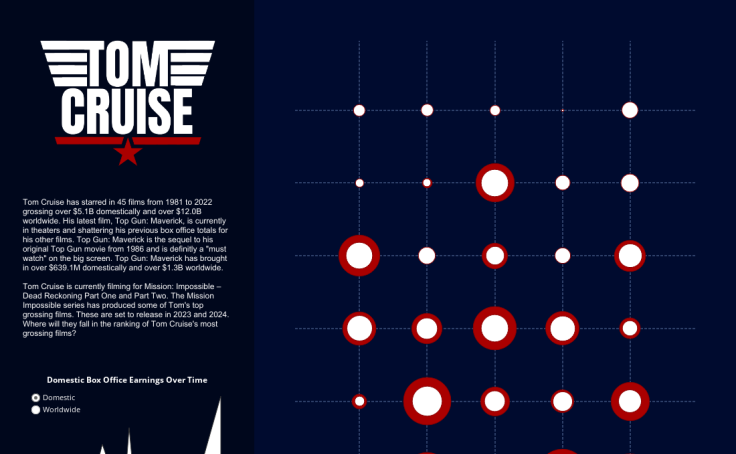
Tom Cruise - Box Office Breakdown
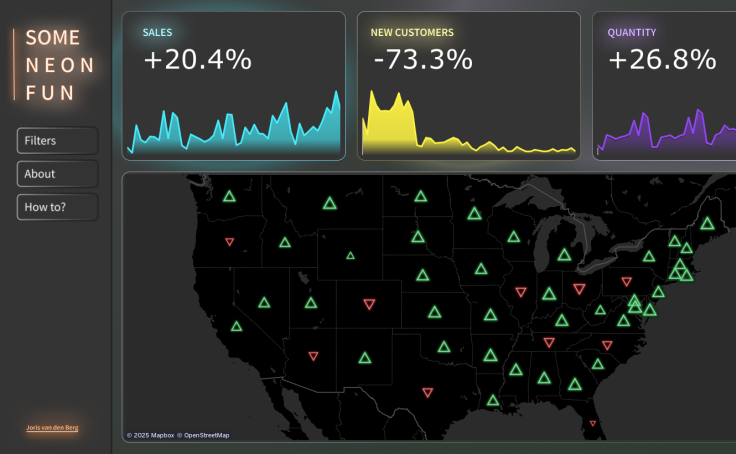
Some Neon Fun

The Magical World Of Star Wars

As your browse this list, we hope you follow your favorite authors and favorite the vizzes you like the most. By doing so, you'll ensure that the authors who built these visualizations receive positive feedback about their work. But you also get the benefit of fresh, customized content on the Tableau Public homepage under From Your Network as this helps us know which authors and vizzes are resonating with you the most. Win-win!
Interested in getting a daily dose of viz-piration? Subscribe to Viz of the Day to have each weekday’s featured viz delivered straight to your inbox.
Love what you see and ready to start honing your own data visualization portfolio? Learn how to grow and refine your data skills with Tableau Public.
Histórias relacionadas

DataFam Roundup June 2026

DataFam Roundup May 2026

Iron Viz 2026: Read Between the Data
 28 Maio, 2026