
Oil and gas technology company, Zedi reduces customer risk by harnessing IoT data from 1.3 million sensors
2 weeks/month saved on financial reporting
Reduced customer risk, preventing monetary loss
Competitive differentiators increase revenue stream
Zedi is a leading oil and gas technology and services company operating in Canada and the United States—managing 1.3 million sensors that generate over 47 million daily data points. Zedi’s CTO chose to embed Tableau Server into the Zedi AccessTM platform, enabling customers to quickly spot equipment or production issues and prevent monetary loss. Zedi also uses Tableau internally, creating a single source of truth for financial and operations data. Tableau is transforming Zedi's approach to analysis, helping save the company two weeks per month on report creation. With help from Tableau, Zedi is creating market differentiation with their embedded service, reducing churn and sustaining a higher recurring revenue stream.
Tableau has the performance we need for our customers and the scalability required for our internal deployment.
CTO adopts Tableau, citing “scalability and performance”
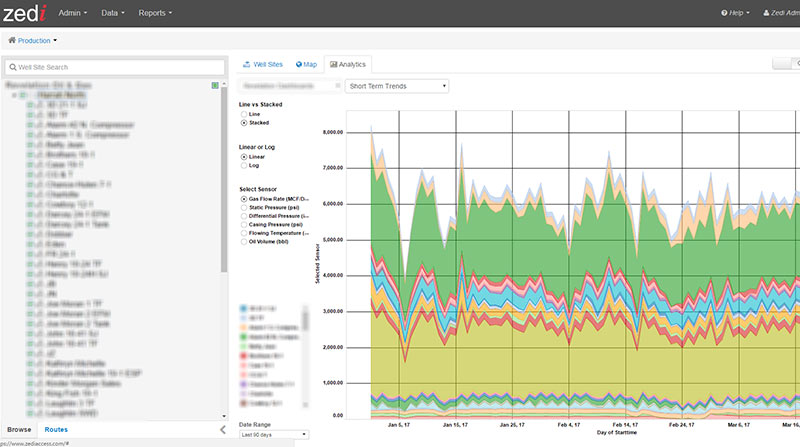
Zedi AccessTM—Zedi’s SaaS remote asset management solution—helps customers track the health of production equipment along with the production process that these assets support. Sensors located in customer upstream field operations send data back to the Zedi cloud platform, where it’s stored in an Oracle database. Zedi shares the analytics output with customers over Tableau Server, embedded into Zedi AccessTM. Data updates in real time or on a scheduled basis, depending on the customer.
Previously, Zedi struggled to find an efficient, scalable analytics platform to integrate into Zedi AccessTM. “The old solution was really awkward and slow and clunky, and it just was not a good experience,” said Doug Watt, Senior Technology Product Manager.
After proving the value of Tableau Server within Zedi AccessTM, the IT team adopted Tableau Desktop and Server internally to support analytics needs across the company.
Doug continued, “Tableau has the performance we need for our customers and the scalability required for our internal deployment.”
Zedi’s IT team manages data quality and governance, enabling business process owners to dive into their own analytics. “We’ve seen creativity and capability pop up all through the organization, leading to more innovative solutions to business challenges,” says James Freeman, Chief Technology Officer.


Tableau is critical to delivering insights. [Tableau] allows customers to quickly sift through all the reams of data to get to the points that they most care about.
Zedi minimizes customer risk with real-time dashboards
Typically an oil and gas producer wouldn’t be able to spot production interruptions until the close of month in some cases.
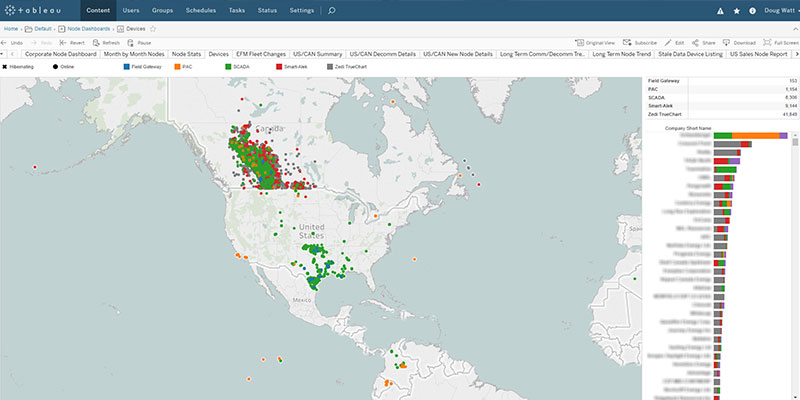
With Zedi AccessTM, customers use Tableau dashboards to track the health of equipment in real time. If a sensor hasn’t called in “three days or three weeks or three months, they’re still paying for it,” explains Doug. “That's a risk, because if something’s failed with that device, they're not getting any value from it.”
If production suddenly falls off, companies often scramble to deploy field forces to deal with the issue. With Tableau dashboards, customers can spot, respond, and resolve issues within one day—reducing downtime and decreasing the monetary risk that comes with an outage.
“Every one of those molecules that comes out has an economic value to the customer,” says James. “Reducing downtime is preserving uptime—preserving the ability to produce cash.”
“Tableau is critical to delivering those types of insights, because it's about how you visualize data in a way that's efficient and allows customers to quickly sift through all the reams of data to get to the points that they most care about,” explains Doug.
Maximizing data from 1.3M sensors for customer care
Internally, the Zedi team uses Tableau to visualize the time-series structured data from over 1.3 million sensors deployed in the field. If a customers’ sensors aren’t calling in as normal, data from Zedi AccessTM displays as an outlier in Tableau and notifies the customer.
“We feel that it has helped differentiate us, allowing us to reduce churn and sustain our higher monthly recurring revenue,” says James.
Similarly, if the team begins to see a trend in failed sensors, Zedi can proactively deploy field staff, preventing a potential disruption to production.
We feel that it has helped differentiate us, allowing us to reduce churn and sustain our higher monthly recurring revenue.
Data governance for financial reporting saves 2 weeks per month
Zedi also uses Tableau to help support and grow its business. For example, Zedi’s finance department brings data from Microsoft Dynamics GP into Tableau—transforming the company’s approach to financial analytics.
Product managers are responsible for profit, loss, and financial reporting on different lines of business and solutions. Before introducing Tableau, the analytics team extracted data out of Microsoft Dynamics, bringing it into Microsoft Access and finally, Excel.
This process led to long reporting cycles of up to two days per month for each of Zedi’s seven product owners. The data “was inconsistent, and everybody had their own different graphs, and they had their own different filters,” recalls Doug. This led to confusion between product managers and the finance team and ultimately created distrust in the data.
With Tableau, the IT team built out a set of core dashboards with the finance team, which acts as a single source of truth for financial reporting for the whole company. “[The finance team] controls how they pull that data out, when they pull that data out, and what data needs to be in there,” explains Doug.
With faster, more accurate reporting, Zedi reduced reporting time by two weeks per month, allowing employees to focus on more strategic projects that move the business forward.
Tableau plays crucial role in strategic plans
Zedi continues to find creative ways to analyze internal data. For example, Zedi’s analytics team recently started blending data from MS Dynamics and Salesforce in Tableau with plans to gain a 360-degree view of the customer experience from billing and customer care to actual use of the Zedi AccessTM product.
Along with sensors, Zedi also builds and manufacturers pump jacks. The team is starting to do predictive analytics in R, displaying the results in Tableau to make it easier to diagnose issues near real-time.
Zedi is now actively expanding applications of Zedi AccessTM and its underlying IoT platform to industries beyond oil and gas. Tableau will continue to play a crucial role as Zedi’s analytics platform of choice due to its flexibility and configurability.
In the meantime, Zedi plans to expand both their internal and external deployments. James notes, “Our employees throughout the business understand their data better. Rather than making them translate their needs to IT, I want to give them the tools to build their own dashboards and look into their own data. Features within Tableau along with the distributed client licensing make this decentralized enablement possible.”