Finnish energy company, Leppäkosken Sähkö reduces reporting time from weeks to hours
Leppäkosken Sähkö provides sustainable energy solutions to tens of thousands of customers across the south-west region of Finland. These energy outputs include electricity, natural gas, steam, and processed water. The fast-growing organization has revenues of $70 million (2015) and 74 employees. With help from Tableau, Leppäkoski is proving that it can compete on the same scale as the bigger energy companies. Leppäkoski adopted Tableau to deliver richer insights into the growing business. Working with local Tableau partner Solutive, Leppäkoski analyzes data in more creative ways, and has the flexibility to dig deeper into outliers. As a result, the company has reduced preparation time for financial and other reporting from weeks to days or hours. The Leppäkoski team has more insight into customer processes and potentially, revenue per business unit. This additional insight into energy generation and procurement processes helps reduce costs and allows them to remain competitive in the market.
Sustainable energy solutions for Finnish customers
As business expanded, Leppäkoski was finding it harder to make sense of its data. Mauno Oksanen, the company’s Business Development Director, summarizes their reporting struggle in one sentence: “Our energy management and other data systems were digital, but our data outputs were analog.” The company relied on manual reporting processes—principally spreadsheets—to turn raw finance, sales, energy output and other data into insight. This approach simply wasn’t scalable enough for the growing business and for future needs. “The reporting data reached decision makers and the business units too slowly,” said Oksanen. “End-of-month reports were often not ready until the second or third week of the following month.”

In the future, Leppäkoski plans to integrate data from Ilmatieteenlaitos, the Finnish Meteorological Institute. They plan to use weather data to predict energy consumption patterns and plan manufacturing output.
The company was manually blending data from different business units, and each used its own style of reporting. Oksanen continues, “In each business unit, we had at least a couple staff members working days each month on reports—that’s a significant percentage of our total workforce time.” Since monthly reporting was so resource intensive, we had to prioritize the data that supported the day-to-day running of the business, such as financial close, turnover, and profit forecasts. We knew that there were hidden insights in our data that remained untapped. “By capturing and analyzing untapped data, we believed the business units would make faster, more informed business decisions—and increase the rate of business growth,” says Oksanen. Since reporting was so resource intensive, the team had to prioritize data that supported day-to-day running of the business, such as financial close, turnover, and profit forecasts. They knew that there were hidden insights in their data that remained untapped. “By capturing and analyzing untapped data, we believed the business would make faster, more informed energy management decisions—and increase the rate of business growth,” says Oksanen. The Leppäkoski team first heard about Tableau from Solutive, a local Tableau consulting partner in Finland. Klaus Iltanen, Project Engineer at Leppäkoski was one of the first to try it. He found that the software was easy to use, but also had the analytical depth they needed to drive insights. “Within 10 minutes of meeting with Solutive, we were convinced that Tableau was a good tool for the business. We later compared Tableau with other data visualization vendors and Tableau scored high in many categories we set: from the open interfaces and protocols, to the flexible licensing, local support here in Finland and also Gartner rating.”
In the past, month-end financial reports were often only ready three weeks into the following month. Now they are automatically available within days or even hours as soon as source system’s data is ready for reporting.
Fast adoption, big impact
With expert support from Solutive and ongoing knowledge transfer, Leppäkosken Sähkö adopted Tableau Desktop and Server within a couple of months. The company now has 12 Tableau Server licenses. “We simply watched the free Tableau Cloud training videos, listened to Solutive’s professional advice, and we were generating visual, interactive reports. As we move forward, the Tableau community forums also contain lots of helpful tips on using Tableau.” Today, the organization has standardized reporting on Tableau within Leppäkoski. Using Tableau, the company can easily analyze and combine data from energy production, automated customer meter reading, billing, customer service, and other data systems—all stored in a Microsoft SQL-based data warehouse. And they can bring data from multiple back-end systems into one view to achieve a comprehensive view of the business. The management team and business units use Tableau Desktop and Tableau Server to quickly create a stream of visual, interactive reports and ask new questions, spot trends, identify opportunities, and make decisions. They now have the flexibility to experiment with trend analyses, regressions, and correlations. And employees can view this data on-the-go, with tablets or mobile phones. Those reports have transformed the way Leppäkoski looks at its data. “In the past, month-end business reports were often only ready a couple weeks into the following month. Now they are automatically available within days or even hours as soon as source system’s data is ready for reporting. The type of agile, online reporting ensures Leppäkoski stays competitive in a fast-changing energy market,” says Oksanen.

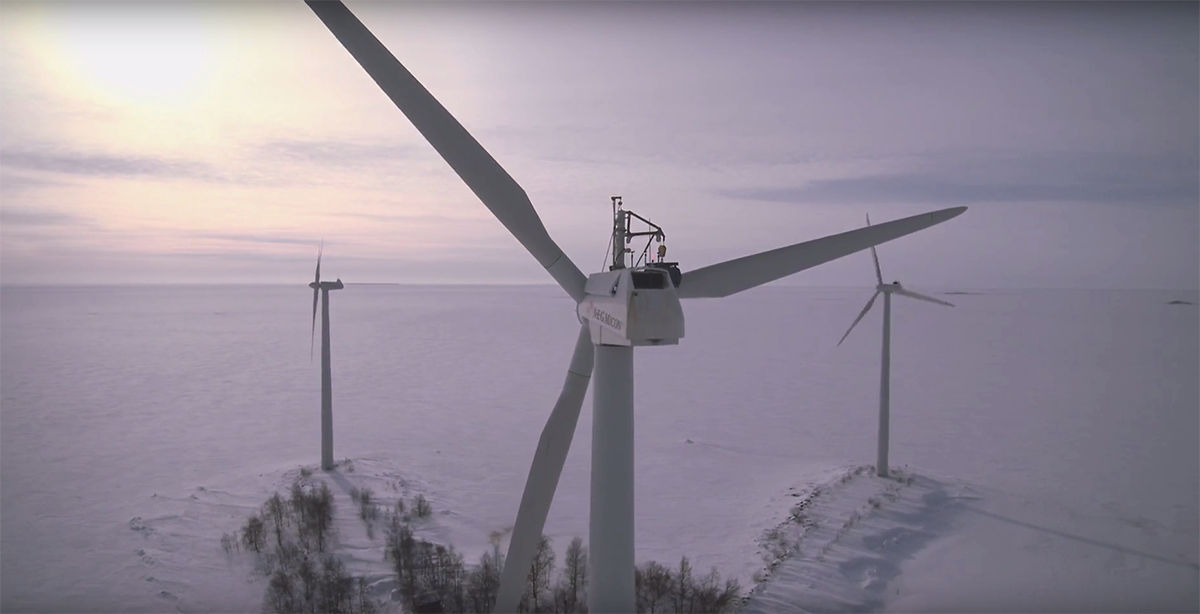
In the summer of 2015, Leppäkoski conducted maintenance on a generator on the Dry Low Island wind farm. Learn more here.
Tableau has not only automated reporting at Leppäkosken Sähkö—it has introduced us to analytics that we never would have imagined.
Opening the door to new insights
Some of the results Leppäkoski has experienced from their decision to deploy Tableau include:
- Improved sales-performance analytics. Using Tableau’s mapping capabilities, Leppäkoski can analyze geographic sales revenues and energy pricing, down to individual towns or districts in Finland for improved sales analysis. For example, the company’s energy-supply line of business can now identify customers that are above or below a certain energy consumption threshold. The company uses this analysis to advise customers on how to cut their consumption. They can also use this data to target opportunities for cross-selling complementary energy services.
- Better customer-satisfaction reporting. The electricity sales team pulls customer satisfaction data from contact center engagements to create reports in Tableau Desktop. They share these reports with customer service staff using Tableau Server to benchmark customer service performance and identify areas for improvement. Additionally, the sales team can analyze channel engagement performance, with a goal to move customers from phone-based communication to the low-cost online channel.
- Optimizing energy production. Leppäkoski brings data from process controls and other energy production plant data sources into Tableau, helping optimize production efficiency and reduce costs. For example, one of the company’s first projects involved monitoring the efficiently of burning wood pellets in one of their energy plants. Analysts can look at deviations from burn-rate averages to correct deficiencies and identify means of lowering the cost of energy consumption.
- Planning for the future. In the near future, Leppäkoski plans to integrate data from public data sources like Ilmatieteenlaitos, the Finnish Meteorological Institute. They will use this weather forecast information to predict energy consumption patterns and plan manufacturing output, helping reduce production waste and save the company money.

Solutive continues to play a vital role in Leppäkoski’s success with Tableau, encouraging business units to create their own self-service reports and get the most out of their data. “Solutive have been like an extension of our own organization,” says Iltanen. “Time and again, their Tableau skills, knowledge and insight have helped Leppäkoski extend its Tableau footprint and make more sense from more data.” With Tableau, Leppäkoski has achieved far more than they had originally planned. “Tableau has not only automated reporting at Leppäkoski—it has introduced us to analytics and data mining that we never would have imagined. We can produce an easy-to-understand snapshot of the business that we can share with all the stakeholders. Business reporting is always an ongoing process.”