5.5 Million Rows of Baby Name Data


Now that Tableau Public supports datasets up to 10 million rows, a few of us on the Tableau Public team thought we'd try our hands at some fantastically large datasets. To kick it off, I used the full Social Security Administration baby names dataset. This dataset contains every name used to apply for a social security card between 1910 and 2013. (One caveat: to protect privacy, a name needed to have more than 5 occurrences in a given state and year to count.) This is a monster dataset at over 5.5 million rows of data.
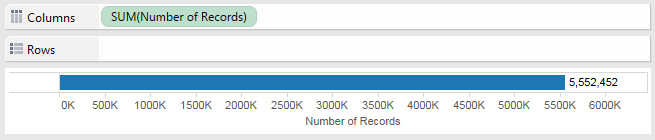
That's a lot of babies...and a lot of diapers.
I created this Tableau Story, first highlighting some things I found interesting and then letting you input your own name and get a history of it. I compared the popularity of all the Team Public names (not a lot of love for Dashiell it seems!), comparing the different versions of Mary, and my favorite, comparing all the one name pop divas. Who knew Rihanna was so influential to recent mothers?

Checking out my own name, it appears that another one name musician had an influence on moms and dads in the late 90's.
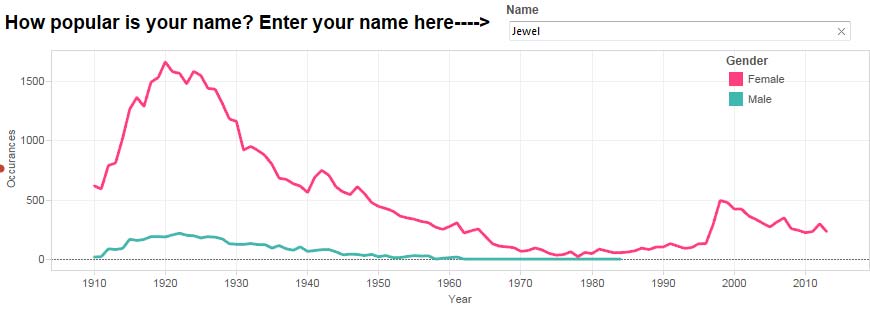
Who will sa-a-ave your soul... if you keep asking me if I was named after the singer?
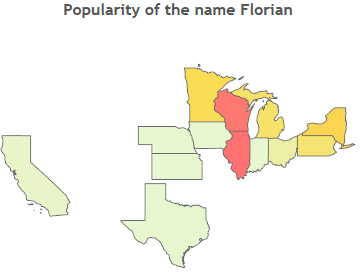
Clicking on the treemaps will filter the map so you can see what names are more popular where. In the Mary, Marie, Maria point, Maria is much more prominent in California and Texas, places with more of a Hispanic population. Our own German Tableau Publican, Florian, doesn't have a very common name in the US, but it is more common in the upper midwest, where there is more of a German population.
With over 5.5 million rows of data, I've just barely scratched the surface of the kinds of stories you can tell with this dataset. Feel free to download the workbook and see what you can discover! If you find anything fun, be sure to tweet it to me @jeweloree.
Photo credit Donnie Ray Jones via Flickr
Verwante verhalen

Iron Viz 2026: Read Between the Data
 28 mei, 2026

Tableau's Iron Viz Winners

Explore the 2026 Iron Viz Entries
 15 december, 2025